I love VMware (used it since its first releases) and I love it even more now 😄.
Yesterday I had the not so crazy idea (and not original) to use VMware for Mac OS X kernel debugging because newest Little Snitch version seems to have a new anti-debug trick and I don’t have another Mac at hand.
After some trial and error I managed to get it working, so let’s show how it’s possible.
The first thing you need to do is read these two Apple documents, this and this. We need two machines, one to be the target and one to be the debugger. A VMware virtual machine can be used for target machine which is great!
Our workflow should be something like:
Install Leopard inside a VMware virtual machine.
Read this forum thread to learn how to do it. The signiso.sh script might need small fixes and if you upgrade VMware Fusion after you installed Leopard into the virtual machine, you will need to sign again the updated VMware iso images (else you will get an error telling it’s not a valid machine or something like that).
Start Leopard inside the virtual machine and update to the same patch level as your debugger machine.
Download Kernel Debug Kit from here into the debugger machine. You should download a version that matches your current kernel (probably 10.5.6 if you are using Leopard up to date). This debug version will allow us to breakpoint on symbols since it has symbol information. Btw, you will need to open a developers account, it’s free!
Download XNU kernel source code from here. This will allow to follow the source inside GDB and even breakpoint into line numbers!
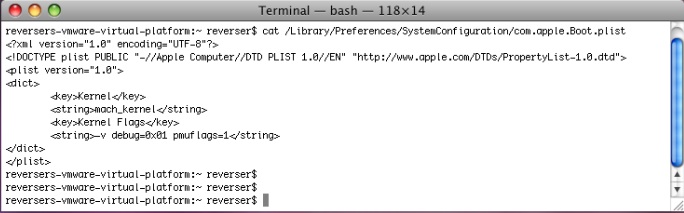
Configure the virtual machine so we can attach the debugger to it. The Apple articles talk about changing NVRAM settings but there’s no such thing for VMware. There is another trick we can use! Edit the following text file, /Library/Preferences/SystemConfiguration/com.apple.Boot.plist. You can add our needed options at Kernel Flags key. Use the -v flag (for verbose output), pmuflags=1 (to avoid watchdog timer problems) and debug=0x1 (or other debug flags available, read the initial referred documents). I prefer to use the debug=0x1 flag because I couldn’t find a way to create NMI events inside the virtual machine. I want to do kernel debugging while it’s running ok, not just when it crashes 😄. Example:
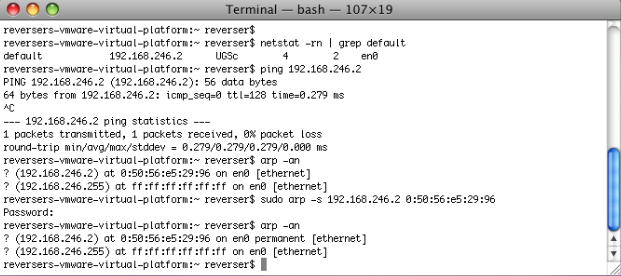
Insert a static arp entry for debugger machine IP in target machine. We are talking about VMware virtual networks. Check the following picture, you should be able to understand it 😉.. Take note of target machine IP address (open a Terminal.app and do a ifconfig en0, for example). This will be the IP address we are going to attach GDB from debugger machine.
At debugger machine, open kernel debug kit dmg image. Now open GDB like the following example. You will need to issue the GDB command target remote-kdp. This will tell GDB to enable remote kernel debugging protocol.
$ gdb /Volumes/KernelDebugKit/mach_kernel
GNU gdb 6.3.50-20050815 (Apple version gdb-962)(Sat Jul 26 08:14:40 UTC 2008)Copyright 2004 Free Software Foundation, Inc.
GDB is free software, covered by the GNU General Public License, and you are
welcome to change it and/or distribute copies of it under certain conditions.
Type "show copying" to see the conditions.
There is absolutely no warranty for GDB. Type "show warranty"for details.
This GDB was configured as "i386-apple-darwin"...
gdb$ target remote-kdp
Reboot virtual machine. You should get a verbose boot and as soon it stops or the blue screen appears, you can attach GDB. Sometimes (at target machine) you will get a prompt telling it’s waiting for the debugger to attach, other times it stops while in the verbose boot and others it stops while at the blue screen. I can’t get consistent results on this, I just know I can attach the debugger at this time. So, when it stops, attach GDB with the attach IP command. For example my target machine IP is 192.168.246.128. I used the following:
gdb$ attach 192.168.246.128
Connected.
Error while running hook_stop:
Invalid type combination in ordering comparison.
gdb$ c
That error should be normal if you are using .gdbinit (because of the bug described here). Type c or continue and Leopard should finish booting (if you take much time doing this, boot might hang and you need to reboot virtual machine and start again).
That’s it! But you can’t use normal Control-C to break into the debugger. This doesn’t work 😦. Since we can’t break into GDB anytime we want, we can use a little trick which is to setup a known breakpoint at step 9, before we issue the continue command. A good candidate is the tcp_connect kernel function. Why? Because we can use the telnet command to connect to some IP and that will use tcp_connect! So the reformulated step 9 should be:
$ gdb /Volumes/KernelDebugKit/mach_kernel
GNU gdb 6.3.50-20050815 (Apple version gdb-962)(Sat Jul 26 08:14:40 UTC 2008)Copyright 2004 Free Software Foundation, Inc.
GDB is free software, covered by the GNU General Public License, and you are
welcome to change it and/or distribute copies of it under certain conditions.
Type "show copying" to see the conditions.
There is absolutely no warranty for GDB. Type "show warranty"for details.
This GDB was configured as "i386-apple-darwin"...
gdb$ target remote-kdp
gdb$ break tcp_connect
Breakpoint 1 at 0x24d1e0: file /SourceCache/xnu/xnu-1228.9.59/bsd/netinet/tcp_usrreq.c, line 874.
gdb$ attach 192.168.246.128
Connected.
Re-enabling shared library breakpoint 1Error while running hook_stop:
Invalid type combination in ordering comparison.
gdb$ c
Try to telnet somewhere. As soon as you press enter the virtual machine should hang and GDB should have control. Something like this:
Breakpoint 1, 0x0024d1e0 in tcp_connect (tp=0x28c5a68, nam=0x1ad97ed8, p=0x27b904c) at
/SourceCache/xnu/xnu-1228.9.59/bsd/netinet/tcp_ usrreq.c:874
874 /SourceCache/xnu/xnu-1228.9.59/bsd/netinet/tcp_usrreq.c: No such file or directory.
in /SourceCache/xnu/xnu-1228.9.59/bsd/netinet/tcp_usrreq.c
Error while running hook_stop:
Invalid type combination in ordering comparison.
gdb$
The No such file or directory error is due to the fact I don’t have the XNU kernel sources installed. If you want, unpack them somewhere and create the SourceCache link at disk root or create /SourceCache and unpack there (whatever suits you).
Now you are inside the kernel, you can setup other breakpoints and do whatever you want.
About the .gdbinit problem. We can still use our beloved .gdbinit but we need an additional trick to work around it. Create a file with the following context (suggestion: gdbinitfix, located in your home dir):
set$SHOW_CONTEXT=1set$SHOW_NEST_INSN=0set$CONTEXTSIZE_STACK=6set$CONTEXTSIZE_DATA=8set$CONTEXTSIZE_CODE=8set$SHOWOBJECTIVEC=1set$displayobjectivec= 0Now at step 9 or 11, you need to issue the “source” command:
gdb$ source ~/gdbinitfix
This will add the missing variables and now you can fully use .gdbinit with kernel debugging 😃.
And that’s it! We can now use kernel debugging with a single Mac machine! Hurray!!! If you have any doubt or problem feel free to leave a comment. I think I haven’t missed any detail.
Word of caution: sometimes the virtual machine seems to hang if you don’t use it for some time. Not sure if this is due to debugger or not. And the kernel debug protocol communication is not super fast, so maybe gdbinit needs some adjustments. Just a word of caution 😄.
As usual, have fun exploring and testing new things! fG!
P.S.: Everytime you reboot the virtual machine you will need to kill the GDB process. It hangs so you will need the kill -9 friend. And Little Snitch runs without any problem inside the virtual machine!
Update: You should add the option -arch i386 (or -a i386) to GDB because VMware only runs 32bits kernels. If you are running a 64bit kernel in the host system and set breakpoints via symbols, you will have trouble since breakpoints will be set to the 64bits version. Thanks to Rennie for the tip.
Also if you are having problems with the virtual machine locking up, try to disable the power options in the virtualized OS X.
Update 2: Very important: You need to have the debugger machine with the firewall turned off! Else kernel panics will happen! Damn 😉.
Update 3: Snare remembered me about the int3 trick if you are developing your kernel modules (as in userland). Insert a asm(“int $3”); where you want to drop into the kernel debugger. In Little Snitch case it is harder to apply because the kernel driver can’t be unloaded.