Little Snitch was among the first software packages I tried to reverse and crack when I started using Macs. In the past I reported some weaknesses related to their licensing scheme but I never audited their kernel code since I am not a fan of IOKit reversing. The upcoming DEF CON presentation on Little Snitch re-sparked my curiosity last week and it was finally time to give the firewall a closer look.
Little Snitch version 3.6.2, released in January 2016, fixes a kernel heap overflow vulnerability despite not being mentioned in the release notes – just a “Fixed a rare issue that could cause a kernel panic”. Hopefully Little Snitch’s developers will revise this policy and be more clear about the vulnerabilities they address, so users can better understand their threat posture. Are there any more interesting security issues remaining in version 3.6.3 (current at the time of research) for us to find?
You are reading this because the answer is yes!
What is Little Snitch?
Little Snitch is an application firewall able to detect applications that try to connect to the Internet or other networks, and then prompt the user to decide if they want to allow or block those connection attempts. It is a super-useful addition to OS X because you directly observe and control the network traffic on your Mac, expected and unexpected.
It is widely popular: I personally make sure it’s the first thing I install when configuring new OS X images.
How is Little Snitch implemented?
The OS X feature that makes Little Snitch possible is called socket filters. A complete description and implementation guide to socket filters is in Apple’s Network Kernel Extensions Programming Guide. The following diagram from this document describes its implementation in the networking stack:
Essentially these filters allow us to access information about incoming and outgoing network connections and make a decision to allow/block the connection. Parent-process information is available making it very easy to implement, for example, an OSI-layer-7 sniffer application, or an application firewall like Little Snitch. Two other filters are available, IP and Interface, which allow filtering traffic at the IP and interface levels. Both are less interesting for an application like Little Snitch and filtering at those levels is probably better achieved with the operating system’s pf firewall.
To install a new socket filter, we call the sflt_register() function in the associated kernel extension. The first argument to this function is a structure where we configure the callbacks we want.
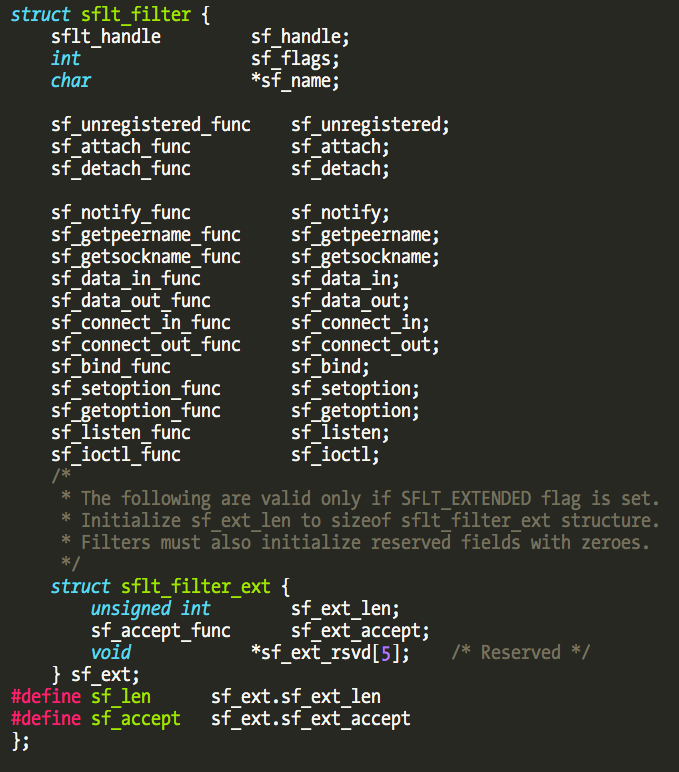
The sf_attach callback will execute when the filter is attached to a socket. Depending on configuration, this happens to every new created socket (after the socket filter is installed) or only to specific sockets (using Apple’s custom SO_NKE socket option). In this callback we can create a cookie to store user-defined data related to the socket, for example the process PID that created the socket. This cookie will be available to all the subsequent callbacks (the first argument to all callbacks that have access to it). The sf_data_in and sf_data_out callbacks are triggered on incoming and outgoing data, allowing us to filter data in transit. The sf_connect_in and sf_connect_out callbacks allow us to filter the creation of incoming and outgoing connections.
Using the Little Snitch kernel extension’s import table to locate the sflt_register() function, we can easily find out what kind of functionality it implements by looking at the installed callbacks.

Little Snitch is interested in filtering every new socket created after it is installed using the SFLT_GLOBAL option. It then configures all the available callbacks, and finally registers the filter. There is a loop (not visible in this disassembly) installing many filters. The reason for this is that filters are tied to a specific domain, type, and protocol, meaning that every possible socket configuration must be specified if we want to filter every possible type of network connection (which Little Snitch is designed to do).
For example, in Apple’s tcplognke sample code we can find two filters, one for IPv4 and another for IPv6, and a specific socket type as shown in the code comments:

You can find additional information about socket filters in my Revisiting Mac OS X Kernel Rootkits Phrack article, section 6.4. There I show you how to locate and dump the kernel structures associated with socket filters and how to attack/bypass them from a kernel rootkit perspective.
Socket filters are an interesting and powerful OS X feature. If you are interested in playing with them you should start with tcplognke source code because it implements packet reinjection. The code is old but it is still the best reference to date.
Anti-debugging measures
One of my very first blog posts was about Little Snitch’s anti-debugging measures. This information is still accurate today but let’s revisit it for a moment since they have a new trick inside their kernel extension.
The Kernel Authorization subsystem (kauth) supports the installation of a listener (process scope) to control which processes can trace or debug other processes. The documentation discusses the following action available in the process scope:
“KAUTH_PROCESS_CANTRACE — Authorizes whether the current process can trace the target process. arg0 (of type proc_t) is the process being traced. arg1 (of type (int *)) is a pointer to an an errno-style error code; if the listener denies the request, it must set this value to a non-zero value.”
The practical meaning of this is that an installed listener will be able to control whether a process (typically a debugger) can debug another process or not. Little Snitch uses this feature to protect its processes from debuggers, code injectors, or anything else that needs to attach to a process (including DTrace).
Kauth listeners are installed using the kauth_listen_scope() function so we can once again easily trace where the driver calls it.

First it allocates some memory for a structure (described in the code comments) that contains four function pointers (the last four structure fields) and some other unknown data. The first field contains the total number of running processes.
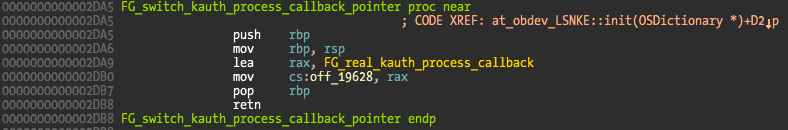
The second parameter to kauth_listen_scope() is the callback, which can be found at address 0x19628 (identified by IDA as off_19628) pointing to address 0x2F9D.

The interesting thing is that this is a fake or non-functional callback!
If we insert a breakpoint on this address it will never be hit when we try to attach a debugger to one of the protected Little Snitch processes. What is happening?
The function sub_2CD2 has two code references, this fake callback and another function. If we look at the second function it contains exactly the same code as the fake callback.
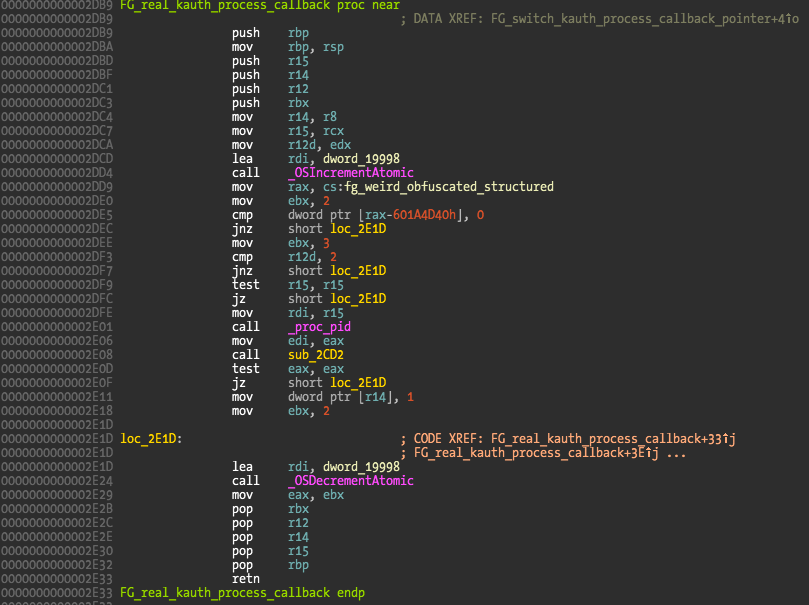
What is happening is that the callback pointer that was at address 0x19628 (the second parameter to kauth_listen_scope()) pointing to address 0x2F9D (fake callback) is replaced with a pointer to above’s function at address 0x2D89 (the real callback). The replacement function is shown below.
One key question about this pointer switch is: when does it happen?
If the listener was already installed, this could be a dangerous operation since the above code has no locks and interrupts are enabled, so crashes could happen. Little Snitch developers aren’t exactly newbies, so they wouldn’t trade off potential kernel panics for a clever trick.
The answer lies in code references. The pointer exchange function is called in the init() method as we can see on previous picture code xref, while the listener is installed in a function call from start() method (address 0x3264).
The trick is that the init() method is guaranteed to be called before any other method in the class, meaning that the pointer switch always occurs first. This only fools the static analysis if we carelessly neglect to look at the disassembler code references. Just a cute trick that could be improved by obfuscating the listener install functions via function pointers.
Two other known anti-debugging tricks are used in Little Snitch’s user applications, ptrace’s PT_DENY_ATTACH and sysctl’s *AmIBeingDebugged.
The PT_DENY_ATTACH description can be found in ptrace’s man page and sysctl’s in Apple’s technical Q&A QA1361 note.
PT_DENY_ATTACH
This request is the other operation used by the traced process; it allows a process that is not
currently being traced to deny future traces by its parent. All other arguments are ignored.
If the process is currently being traced, it will exit with the exit status of ENOTSUP; other-
wise, it sets a flag that denies future traces. An attempt by the parent to trace a process
which has set this flag will result in a segmentation violation in the parent."
The symbols used in these anti-debugging tricks can’t be found in the import table because they are resolved at runtime, and their strings are also obfuscated to further obscure what is happening. The following disassembly output comes from the Little Snitch Daemon binary and shows how a call to the sysctl anti-debug facility is implemented.
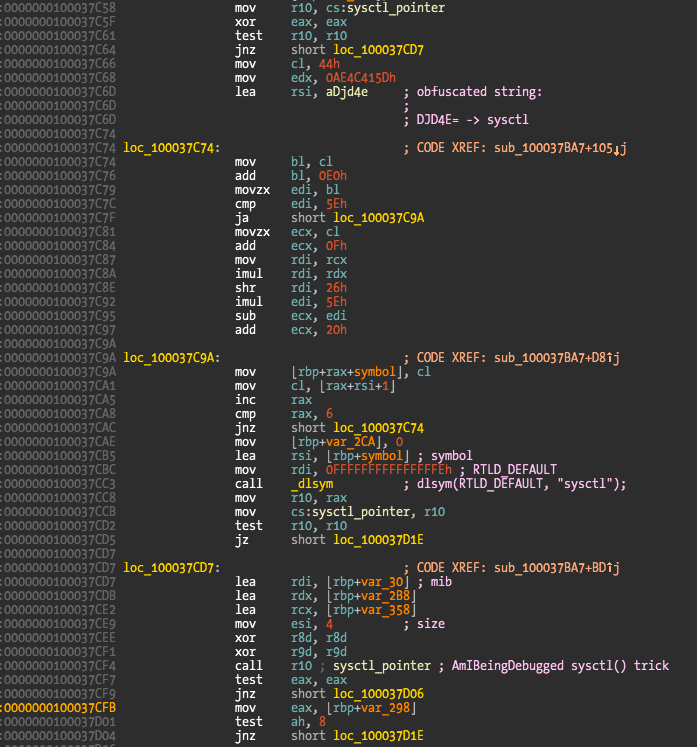
To avoid resolving the sysctl symbol every time it is used, the pointer is stored in a global variable (I labeled it sysctl_pointer). At the beginning of this code snippet we can see the pointer tested against a NULL value. If it’s NULL, it means the symbol is not yet resolved so that needs to be done now.
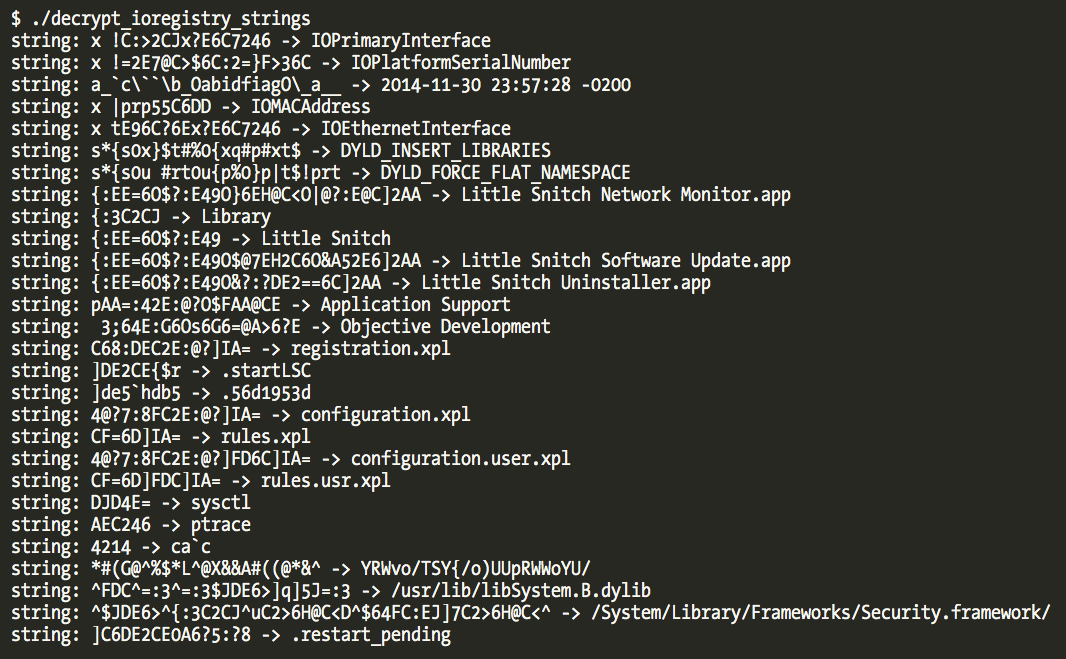
To resolve the symbol, the first step is to deobfuscate a string since dlsym() needs the symbol string as the second parameter. The following screenshot shows some of the obfuscated strings and their deobfuscated version found in the various Little Snitch binaries.
After the string is deobfuscated the symbol is resolved via dlsym(), the function pointer is stored in the global variable, and finally the code executes the sysctl() function pointer. Compare the disassembly with the QA1361 note sample code and you can conclude that this code is implementing the described anti-debugging trick.
The ptrace PT_DENY_ATTACH anti-debugging trick follows next – verify the function pointer, deobfuscate string, resolve the symbol, call ptrace() function pointer.
Both the sysctl and ptrace anti-debugging tricks can be bypassed with a kernel extension such as Onyx The Black Cat, or by breakpointing the ptrace() and sysctl() functions and fixing the return values; this is only valid if you are starting the application under the debugger and not if attaching to already-running processes.
Another alternative is to patch or remove the kauth listener with a kernel debugger or with another kernel extension.
The socket filter cookies
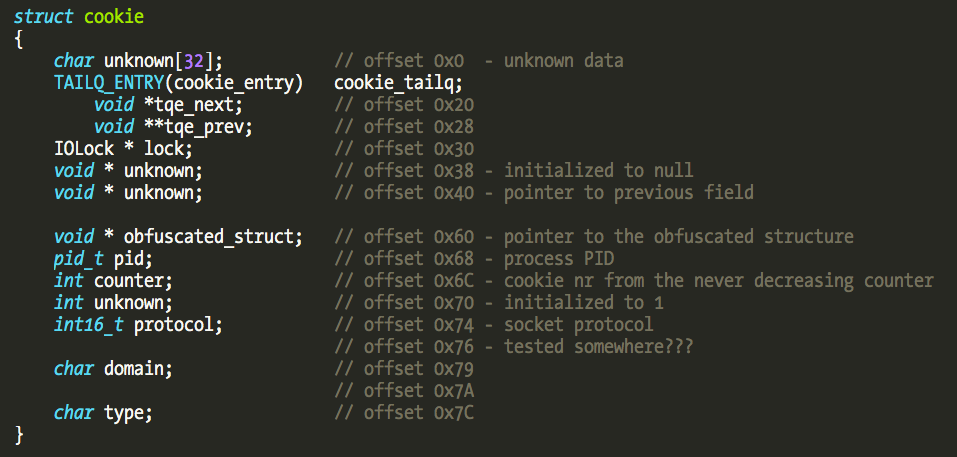
I didn’t fully reverse the cookies’ structure but it is definitely interesting future work to understand what kind of data Little Snitch uses internally in filter decisions. The cookie size in version 3.6.3 is 128 bytes (slightly different in older versions). I came up with the following crude structure description:
We can observe the cookie lifecycle by opening a connection with telnet and two breakpoints, one in the attach callback and another in the connect_out callback. The cookie will be created at the attach callback and we should be able to see the same cookie at connect_out callback when telnet tries to establish the connection. The function that allocates a new cookie is at address 0x10FF0 and is used only from the attach callback.

The next screenshot is from a kernel debugger session with a breakpoint set in the return address of the allocate_new_cookie() function call. Telnet’s process PID is extracted from the cookie structure.
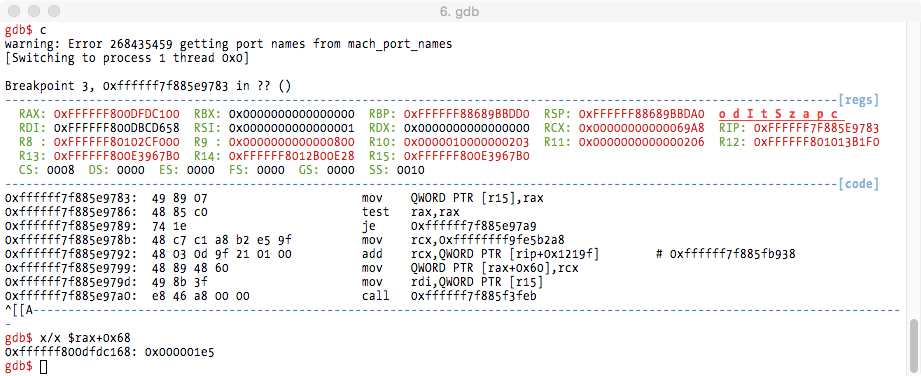
And as soon as telnet tries to establish the connection we hit the breakpoint on the connect_out callback. The cookie in the first argument should be the same and we can verify it is the same telnet process PID.

From the connect_out callback prototype we observe that other arguments are useful to extract socket information.

For example, we can display the IP address the process is trying to connect to from the third argument using a small GDB scripted command. For this to work we need to use Apple’s kernel debug package (available from Developer Download portal, requires free registration as an Apple developer) which contains all structure definitions that assist GDB or LLDB.
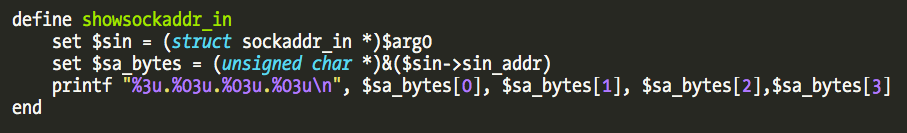
If we set a breakpoint in connect_out out we can use above’s GDB script showsockaddr_in $rdx to display the target network address. This can be useful to distinguish connections if you’re debugging a specific binary and connection.
I/O Kit and Little Snitch
I previously referred to Little Snitch’s kernel code as a kernel extension, but technically it is implemented as an I/O Kit driver instead of a BSD kernel extension. I/O Kit is Apple’s object-oriented framework for developing device drivers based on a restricted subset of C++, while BSD kernel extensions are typically developed in C. The following Apple document Introduction to IOKit Fundamentals is a good reference and introduction to I/O Kit.
Other than the developer’s preference for C++ as a development language, my guess is that Little Snitch developers chose it because I/O Kit drivers are capable of being loaded very early in the boot process while kernel extensions no longer have this ability (afaik!). Previously there was a bypass using com.apple identifiers but mandatory kernel code-signing enforcement killed it. Socket filters can be implemented in I/O Kit drivers or BSD kernel extensions.
Another reason to choose I/O Kit are classes that implement data exchange between user processes and the kernel. Socket filters are implemented at the kernel level, but Little Snitch users have to make a decision about each connection in a dialog running at user level. So, data needs to be exchanged between the driver and Little Snitch’s daemons and applications. More about this to come.
A very good source code example to learn about this data exchange is Apple’s SimpleUserClient.
Little Snitch Classes
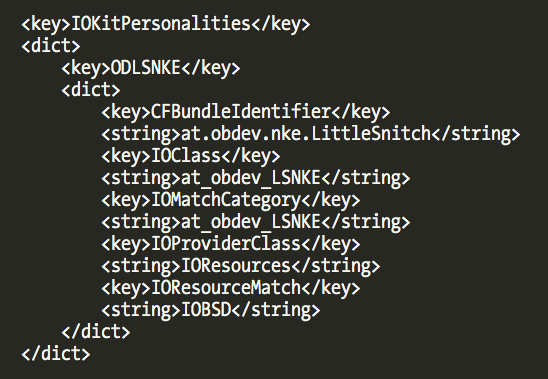
If we load the Little Snitch kernel driver into a disassembler (IDA was used for the screenshots) we can notice a class named at_obdev_LSNKE. This is the main class of the driver as we can also observe in the driver Info.plist contents:
Further class information can be extracted from the __const section. We observe that its parent class is IOService and Little Snitch overrides some IOService-provided methods. This will be extremely useful when understanding its design.
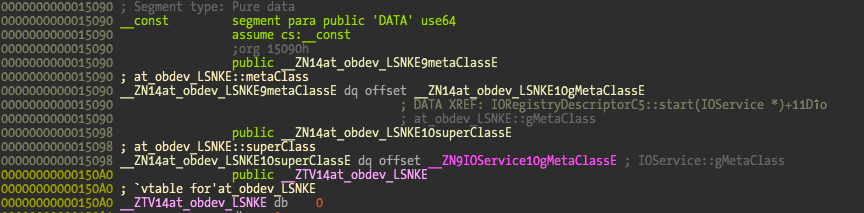
The following picture describes the at_obdev_LSNKE class reverse engineered from the __const section information.
This matches what we saw previously in the anti-debugging pointer switching trick – the init() and start() methods are overridden; init() has a call to the function that exchanges the pointers, and when the driver starts, the real kauth listener is installed in the start() method.
What is the trick to rebuild the class from the disassembly output?
IDA identifies the overridden methods with yellow color which have references to code implemented in the driver itself, while pink color identifies the class methods not overridden. From this information we can easily reconstruct the class structure.
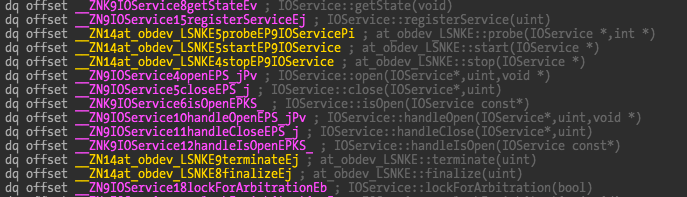
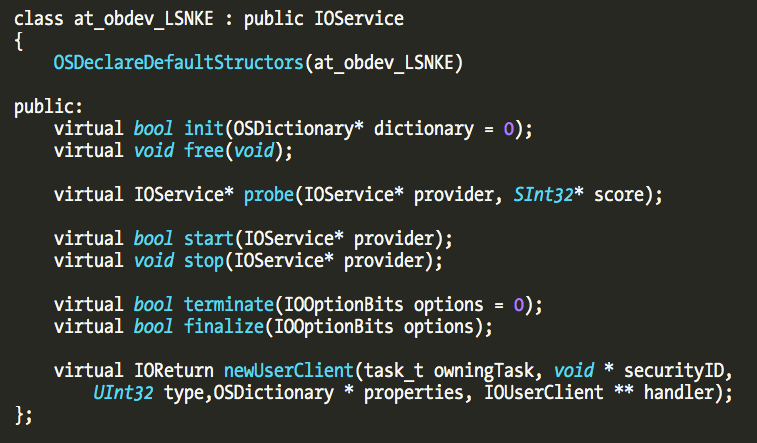
In this partial picture of the at_obdev_LSNKE class we can observe that the probe(), start(), stop(), terminate(), finalize() methods are overridden by the Little Snitch classes.
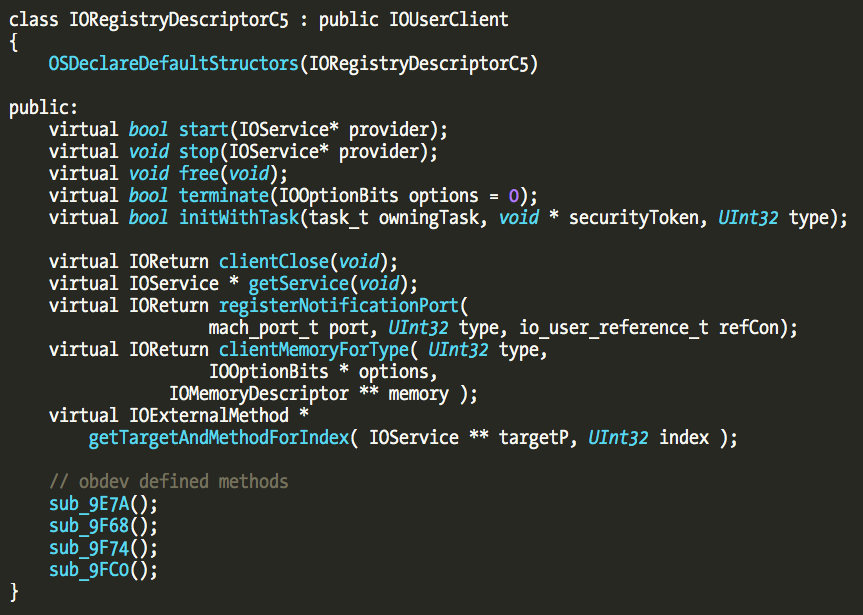
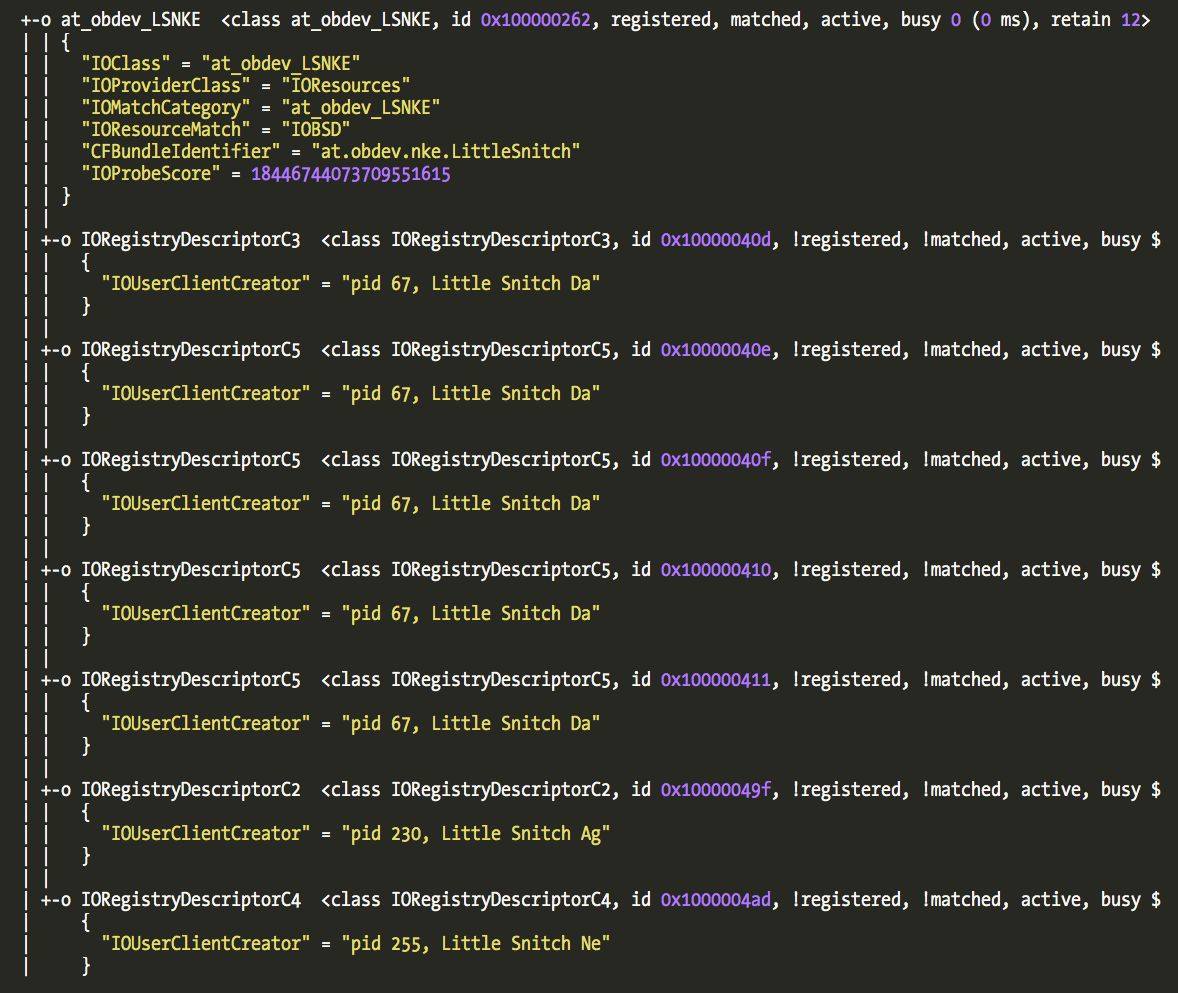
We can use the same technique to identify all the other classes created by Little Snitch. There are two classes IORegistryDescriptorC1 and IORegistryDescriptorC5, whose parent class is IOUserClient, and three classes, IORegistryDescriptorC2, IORegistryDescriptorC3, IORegistryDescriptorC4, which subclass IORegistryDescriptorC1.
The following picture describes the IORegistryDescriptorC1 class, with a few methods overridden and others added by Little Snitch developers.

Its subclasses (C2, C3, C4) themselves override some methods, and also add new ones (maybe a few also overridden from parent class?).
The reason for the different classes is that they are used by different userland clients – Little Snitch Daemon, Little Snitch Agent, Little Snitch Configuration, Little Snitch Network Monitor, and implement different features specific to each userland client.
The IORegistryDescriptorC5 class serves a very specific purpose and thus is slightly different and interesting in its own way. We will explain why later.
How to exchange data between kernel and userland in I/O Kit
As previously stated Little Snitch’s design and implementation must provide some method of data exchange between the kernel and user applications. When an application wants to establish a network connection, the socket filter will intercept it, then send some data about the connection to the user daemon which generates a user alert (it is probably relayed internally to the Agent since the daemon runs as root), the user will click a button to make a decision about the connection, and then the decision will have to be relayed back to the kernel.
Little Snitch implements bidirectional communication channels – one from user applications to kernel, and another from kernel to user. In the first, the request is always user application initiated and can be used to transmit data to the kernel or receive data from the kernel (possible for the same request to send data and receive data). In the second channel, it is the kernel that initiates the data transmission (technically it notifies user application that some data is ready to be read).
In some scenarios there is no need for the second channel, since polling can be used to ask the kernel if new data is available. This might not be very efficient in some scenarios. To my surprise, Little Snitch design uses some kind of “polling” as we will see later on.
Let’s start by reversing connections made from the user application to the driver. The I/O Kit class that implements this feature is IOUserClient, the parent class of IORegistryDescriptorC1 and IORegistryDescriptorC5. This is the class that SimpleUserClient code uses to communicate between a driver and a user client application.
The connection from user application is established using IOServiceOpen() function. One of its parameters is the service we want to connect to, specifically the class at_obdev_LSNKE. The service can be found using IOServiceGetMatchingService() or IOServiceGetMatchingServices() (this one returns an iterator object you can traverse). The following code snippet shows how to open a connection to Little Snitch driver.
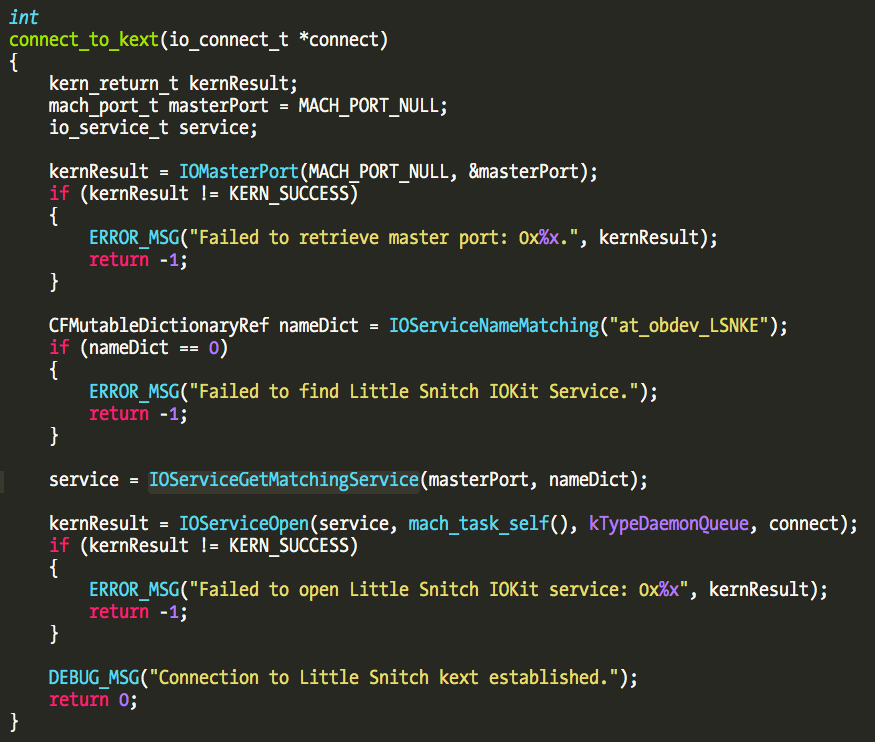
The third parameter to IOServiceOpen() is an integer defining the type of connection to be created. Little Snitch implements five different types, used to distinguish between the different clients. To find the client types we need to disassemble each binary and trace the calls to IOServiceOpen().
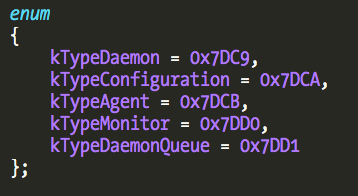
The Little Snitch Daemon supports two connection types, plus one type for the remaining Little Snitch applications: Agent, Network Monitor, and Configuration (I did not take a look at Software Update and Uninstaller).
Establishing a connection from the user application is pretty simple and elegant. Let’s see what happens on the kernel side. The following picture shows the logs from SimpleUserClient driver when it is loaded and a user client connects.
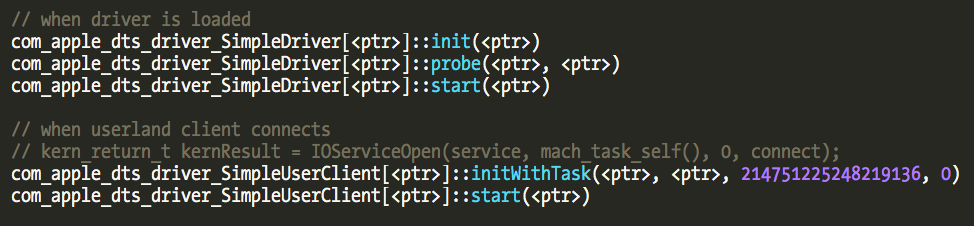
Little Snitch classes override the initWithTask() method, since they are interested in doing something specific when a new client connects. But before a client gets into IORegistryDescriptorC1 or other classes there is a very interesting kernel method executed, newUserClient(), which Little Snitch also overrides as we saw in at_obdev_LSNKE class definition. This is the method that instantiates a new user client object. Its third parameter is the client type.
Depending on the client type, newUserClient() will instantiate a new object from IORegistryDescriptorC2, IORegistryDescriptorC3, IORegistryDescriptorC4, IORegistryDescriptorC5 classes, and then initWithTask() will be called.
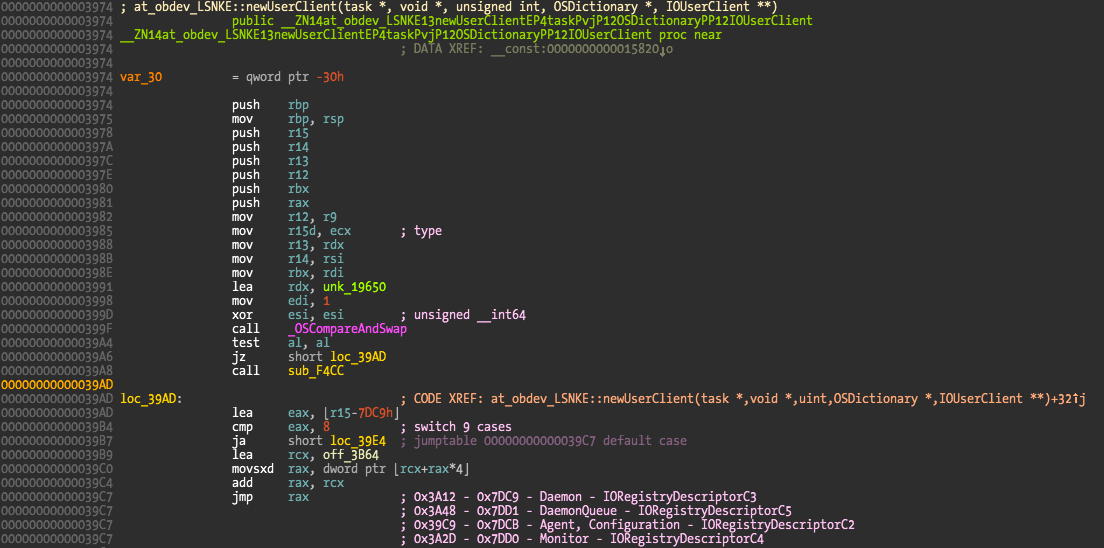
This picture shows the switch statement based on client type parameter. I added notes regarding the client type and instantiated class. Below we can observe initWithTask() and start() being called and directed to different addresses based on the class the object belongs to.

To find the target address of those indirect calls, we can use a kernel debugger to breakpoint and examine the final call address or we can compute it ourselves from the class information (since we know the class the object belongs to).
The offset value in the first call at address 0x3A76 is 0x8E8. We just need to find the base address of IORegistryDescriptorC3 class, add the offset and we have the method this call is referring to. The base address for this class is 0x15A30, adding the 0x8E8 offset gives an address of 0x16318, the location of initWithTask() method; it is overridden and points towards IORegistryDescriptorC3::initWithTask() at address 0x99DE. I haven’t shown all the classes definition but only C1, C3, and C5 override initWithTask() method, which is the reason why Little Snitch Agent, Configuration, and Monitor all share C1’s initWithTask() while the C3 and C5 classes have their own initWithTask() implementation.
With this we are able to map which class is being used for each client type. At this point we have a connection established from user application to the kernel driver. The next step is how data is sent by user application and received by the kernel.
This is achieved by implementing methods in the user client class (IORegistryDescriptorC* classes) that can be called from the user application and will expose whatever services the kernel driver wants to provide to the user client.
To invoke these methods the user application uses certain functions, which allow passing a variable-sized array of 64-bit integers or a structure to the kernel, and also receive the same type of data from the kernel. These functions are IOConnectCallMethod(), IOConnectCallStructMethod(), IOConnectCallScalarMethod() (and complementary Async versions for all three).
For example, to query the current Little Snitch filter status and assuming we have a valid connection to the driver we use the following code:
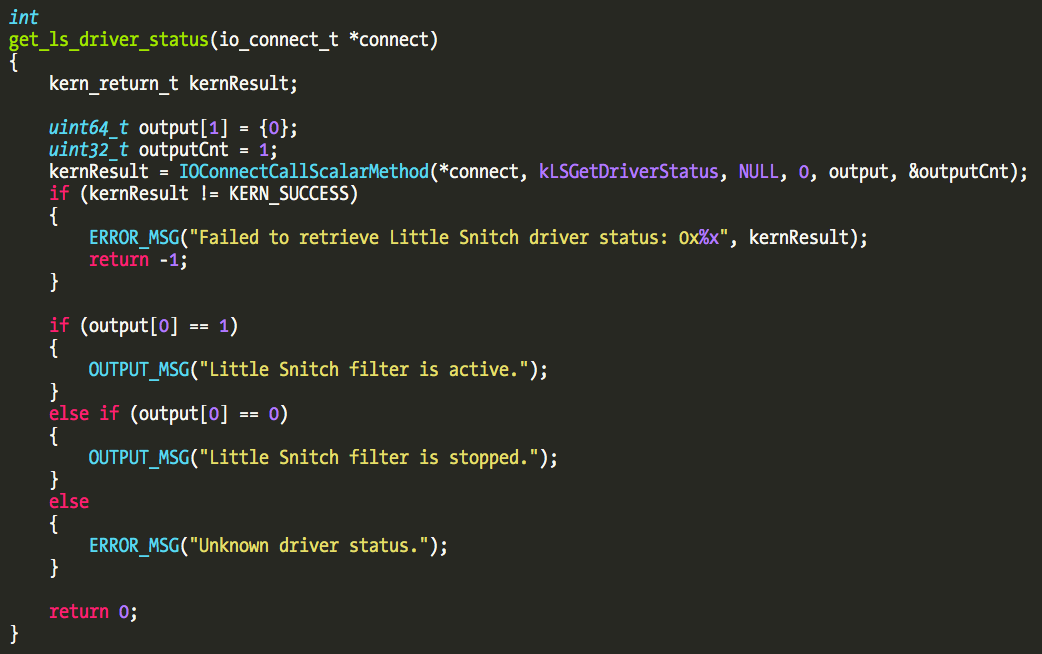
In this case this is an output type method, meaning that the kernel will send us data on the output array we pass on the IOConnectCallScalarMethod() request. Little Snitch implements 28 methods.
Where can we find these methods in the driver code?
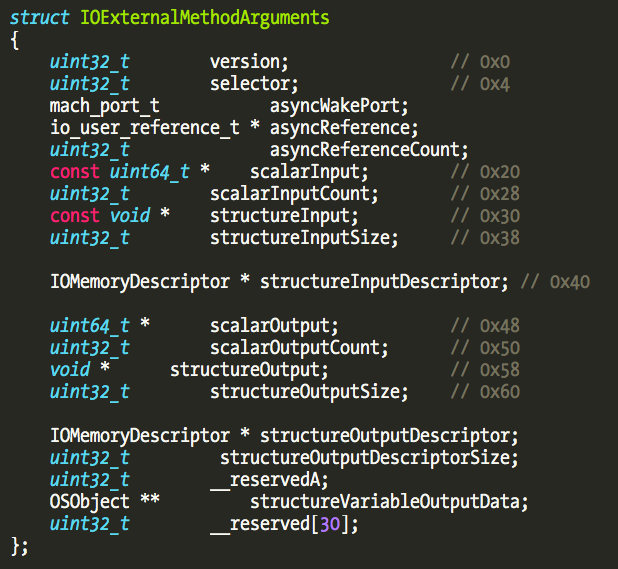
Once again, they can be found at the __const section. It is an array with elements of the following structure:

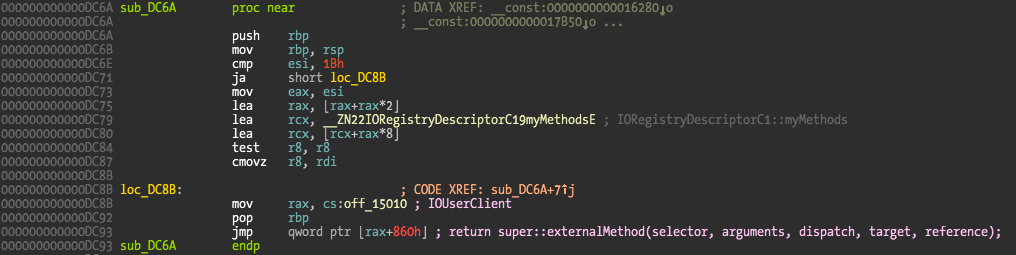
The first element is a pointer to the kernel method that will receive the user application request, and the remaining fields contain the size of the input and output data the user application is sending or requesting. One way to locate this array is to go through the __const section and visually look for this kind of structure, which isn’t hard to locate, or to write a script to try to locate this kind of structure array (Fermín J. Serna did it here). Another simpler trick is to locate the externalMethod() implementation which references this array. The externalMethod() is the new KPI that supports 32-bit and 64-bit processes, while the older getTargetAndMethodForIndex() only supports 32-bit processes.
In this case the externalMethod() method is located 0x850 bytes from the start of the class definition. The first four IORegistryDescriptorC* classes implement this method but C5 is special and doesn’t support these methods. On all four the externalMethod() is implemented by the same function at address 0xDC6A which references the array at address 0x17DC0.
The next screenshot shows part of this array with some of my notes about what I think they do. Of the 28 methods implemented by Little Snitch a few point to the same function (address 0xD7EA) that just returns zero.

The method that returns the filter status is number 14, so let’s take a look at its implementation.

The code retrieves the status of the driver from an internal structure and writes it into the scalar output buffer, which was the user buffer we passed on the IOConnectCallScalarMethod() function. The RDX parameter is a IOExternalMethodArguments structure and offset 0x48 corresponds to the scalar output pointer.
Generally these methods are one of the main things you want to fuzz in I/O Kit drivers since the input data is user controlled, and as a few security researchers have demonstrated (Ian Beer from Project Zero in particular), it tends not to be verified by the recipient. You can find a few papers in my papers section (a few recent ones are missing). I haven’t finished fuzzing all the methods but the code appears to be robust. For example, if we pass bogus data to method 12 all the network traffic on the machine will be blocked until Little Snitch is stopped and restarted (from the Agent menu). Little Snitch developers confirmed to me that this is the expected behavior and their response to bogus data. I discovered this behavior directly via fuzzing.
Method 16 is quite interesting! It is the method that allows userland applications to enable/disable Little Snitch filtering. Which leads to the next question and the interesting vulnerability…
Can an arbitrary client connect to Little Snitch driver and disable it?
No. Well, sort of, or else you wouldn’t be reading this blogpost.
Little Snitch implements driver checks that attempt to restrict driver connections to particular user applications. It will hash the binary of the client trying to connect to the driver and verify if it matches the hardcoded whitelist of authorized Little Snitch binaries.
The problem is that its design suffers from a TOCTOU bug (Time of Check to Time of Use), or to be more precise, a TOUTOC bug (Time of Use to Time of Check).
This bug allows us to bypass the checks and run arbitrary code inside the Little Snitch binaries. I achieve this by injecting a dynamic library into a Little Snitch process, connect to the driver, and call the disable driver method 16. The legit user applications will not detect the change because they are not polling the driver status: they assume they are the only application able to control the driver (implementing this polling could be a future improvement to Little Snitch). It might also be possible to inject new firewall rules but I haven’t tested this scenario.
Let’s look at the driver implementation to understand the bug.
Remember that when a user application tries to connect to the driver the method newUserClient() will be called first, instantiate the correct class and call the class method initWithTask(). IORegistryDescriptorC3 overrides initWithTask() but then calls the IORegistryDescriptorC1::initWithTask() method so we will only take a look at this implementation. IORegistryDescriptorC5 doesn’t verify the client connection which we will analyze later since that introduces a DoS vulnerability.
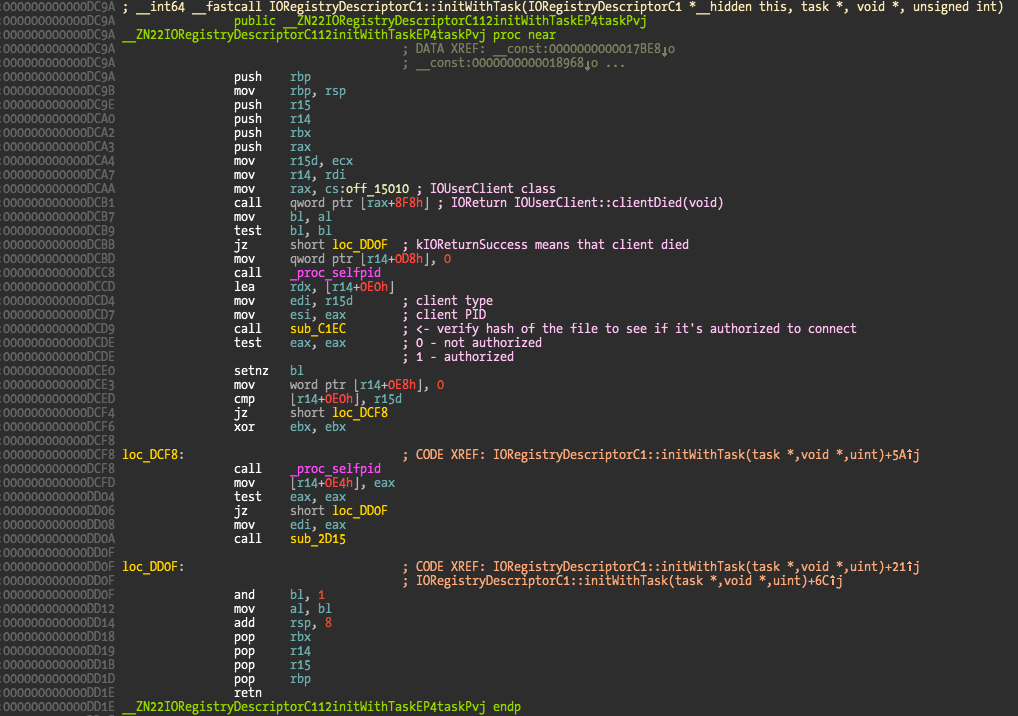
First there is a check to see if the user application client didn’t died before we verify it (IOUserClient::clientDied() method), and then at function sub_C1EC is where the client is verified. A return value of zero means that the client is not authorized to connect and newUserClient() will deny the connection returning a value of kIOReturnNotPermitted (0x0E00002E2), while a return value of one means the client connection can proceed. You can easily verify this by inserting a breakpoint at the address 0xDCDE and verify the return values for Little Snitch binaries and a custom binary (or patched Little Snitch binary).
The verify function is huge and I’m not interested in fully reversing it because it’s not a priority to understand everything it does, we just need to understand its output given different inputs. Sometimes there is no need to reverse everything – just assume it is a blackbox that maps inputs to outputs and that’s it. This saves time and effort for more important things when you’re beginning a research project.
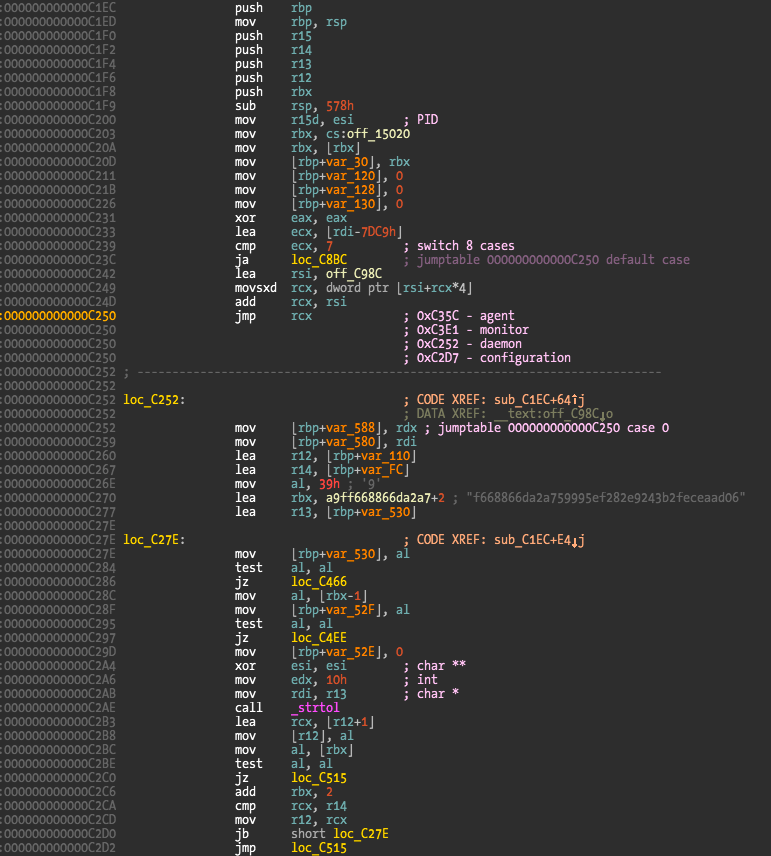
We observe that the verify function supports different client types (address 0xC250 with jump table target addresses in comments) and then what appears to be an hash. Code references to the SHA1 function family can be seen in the function.
One easy way to bypass this check is to inject a dynamic library into an authorized process. Are we able to (easily) do it?
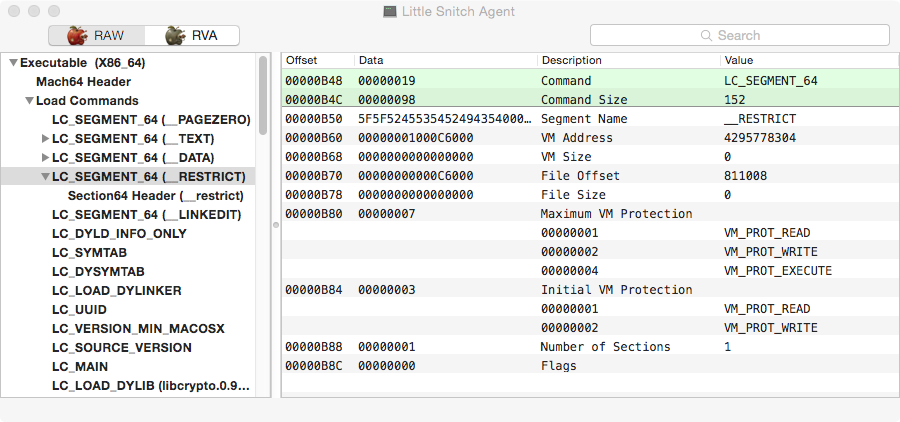
The easiest way to achieve this is to inject the library using the DYLD_INSERT_LIBRARIES environment variable. Remember that code injection by attaching to a process is protected by the kernel. Little Snitch developers obviously are aware of this and block DYLD_INSERT_LIBRARIES injection using a dyld (the linker) feature. If a __RESTRICT segment and a __restrict section exist, dyld will not load any library specified by the aforementioned environment variable which effectively blocks an easy injection vector into Little Snitch processes. For a good description about the dyld __RESTRICT feature, please refer to this blogpost.
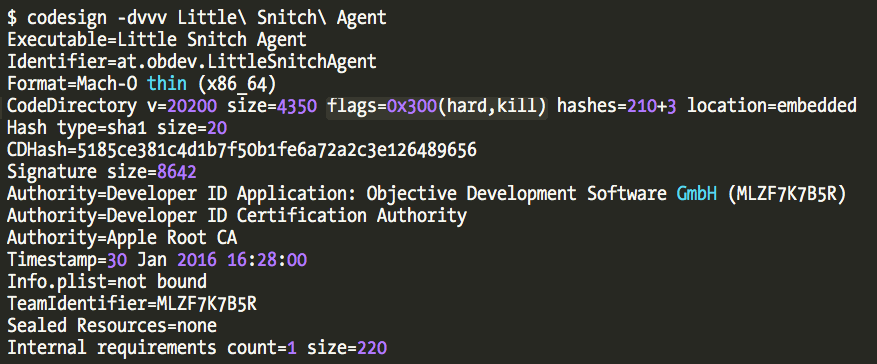
We could bypass this restriction by editing the binary Mach-O header and renaming the __RESTRICT segment (a single bit flip is enough). The problem is that this will modify the binary’s hash and fail the driver’s verification, and subsequently OS X’s code signature verification. The binaries are set to hardkill if code signature verification fails, meaning that process will be killed immediately.
How to exploit the vulnerability?
Let’s recap our situation. We know that there is a logic mistake in the way the user client application is verified by the driver – the client is verified only when it tries to establish a connection to the driver, never before. Little Snitch binaries are also configured to deny library injection and will be killed if OS X code signature verification fails.
The first thing we can do is to eliminate the OS X code signature in Little Snitch binaries. The reason for this is that both the driver and the application ignore the official code signature; only the operating system looks at it when we try to load the binary and driver. So we can simply remove the code signature from the binary (no Gatekeeper interference because the binary is already installed and no longer quarantined).
The easiest way to strip the code signature is to edit the number of load commands and their size from the Mach-O header. If we configure the header to have one less command (specifically, the code signature command), OS X will interpret the binary as not having a code signature. This super easy trick is possible if the code signature is the last command in the header, which is the most common case. Optool and macho_edit are some utils that support removing code signatures in other cases.
Since we got rid of the potential for hardkill, we can also modify the header and remove the dyld injection protection (modify the name of __RESTRICT segment). This allows us to finally fully control Little Snitch code from our own injected library.
But, we just modified the binary so driver client verification will still fail! This is where the vulnerability becomes obvious (hindsight is always 20/20). Because the check only occurs when we try to connect to the driver via IOServiceOpen(), what we shall do is revert whatever we patched in the binary before connecting and everything will look intact when the driver reads the file to hash its contents. Quite simple, quite powerful.
Since all the Little Snitch applications’ filesystem permissions are correctly configured and can’t be written by a regular user, we merely need to make a copy of the application we want to attack, modify it, and inject the library.
The library will then open the binary and restore the patched bytes before it opens the connection. Now we are free to use our own code to connect to the driver and issue commands, or just reuse application functions. Remember that we have full arbitrary code execution within the application context, so we can do whatever we want. This is probably the easiest way to exploit this logic vulnerability but it might be a good exercise to try other possibilities.
I am not releasing the exploit source code but the story doesn’t end here. There is an extra step to have our own code connect to the driver, but I am not going to discuss it here. It essentially requires two methods and some reversed code (or reusing application code, which I did) to be called before we can issue the disable driver command. I will leave this as an exercise to the readers truly interested in writing exploits for this bug.
How data is exchanged from the kernel to user applications?
We have seen that user applications send (and receive) data to the kernel via the IOUserClient class. They are able to pass (and receive) data in either integer variable arrays or structures. But how is the kernel able to send data to user applications without them having to poll via IOUserClient?
Little Snitch implements this feature using the IODataQueue class, which has been deprecated in favor of IOSharedDataQueue class. If you follow OS X security this will ring a bell since both have been exploited by Ian Beer in the past (here, here, and here). IODataQueue class documentation describes it nicely and gives us the right tips to reverse Little Snitch implementation:
“A generic queue designed to pass data from the kernel to a user process.
The IODataQueue class is designed to allow kernel code to queue data to a user process. IODataQueue objects are designed to be used in a single producer / single consumer situation. As such, there are no locks on the data itself. Because the kernel enqueue and user-space dequeue methods follow a strict set of guidelines, no locks are necessary to maintain the integrity of the data struct.
Each data entry can be variable sized, but the entire size of the queue data region (including overhead for each entry) must be specified up front.
In order for the IODataQueue instance to notify the user process that data is available, a notification mach port must be set. When the queue is empty and a new entry is added, a message is sent to the specified port.
User client code exists in the IOKit framework that facilitates the creation of the receive notification port as well as the listen process for new data available notifications.
In order to make the data queue memory available to a user process, the method getMemoryDescriptor() must be used to get an IOMemoryDescriptor instance that can be mapped into a user process. Typically, the clientMemoryForType() method on an IOUserClient instance will be used to request the IOMemoryDescriptor and then return it to be mapped into the user process.”
IODataQueue will create a variable-sized shared memory segment between the kernel and the user application, and the kernel will notify the user application when data is available via Mach messages. The following Apple Mailing list post describes all the necessary steps to implement this in the driver and user application.
We know that IORegistryDescriptorC5 class implements this feature because it overrides the registerNotificationPort() and clientMemoryForType() methods, and also initWithTask().
If we take a look at initWithTask() method we can’t find anything related to IODataQueue there. The relevant portion is instead found in the start() method.
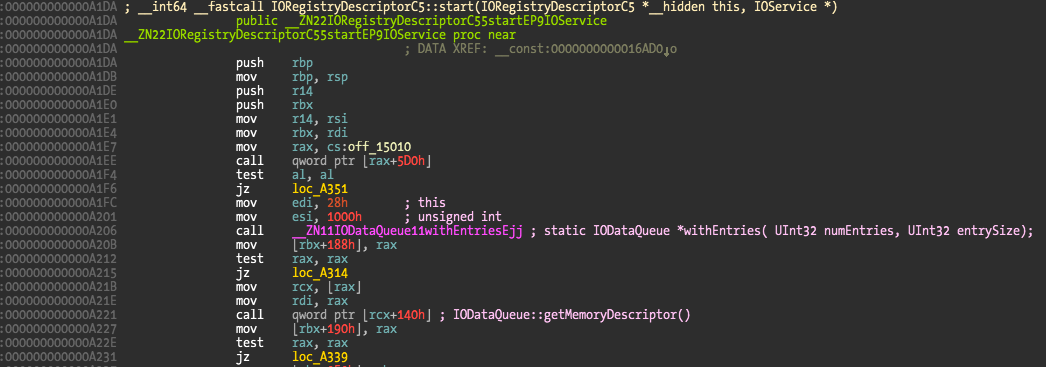
So every time a user application tries to connect to the driver using IOServiceOpen() with type 0x7DD1 a new IODataQueue will be created in the kernel. This leads us to another vulnerability: a denial of service. For some reason (someone forgot to do so?) the IORegistryDescriptorC5 class doesn’t attempt to validate user clients. This means that we can create a small user application that does nothing but open connections to the driver with type 0x7DD1, creating thousands of IODataQueues until we exhaust kernel memory. When that happens the system will simply hang or kernel panic. A virtual machine with 2GB of memory is exhausted in less than a minute, while a Mac Pro with 32GB of RAM takes around 15 mins using a single thread (the 8 cores can probably be used to kill it much faster). In my case the kernel finally panicked via a watchdog time out.
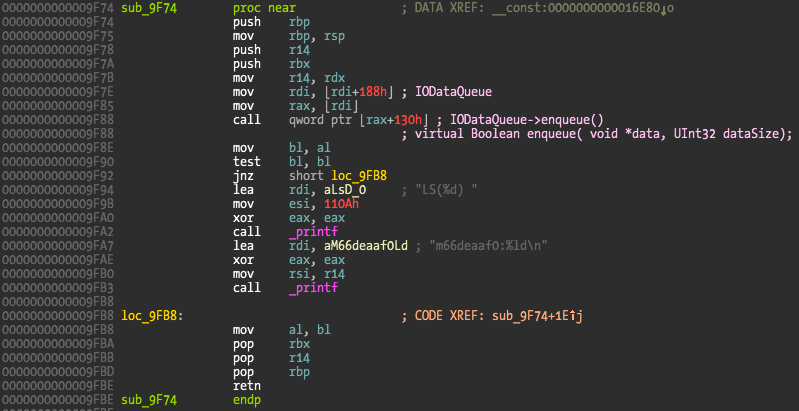
The method that is responsible for enqueueing the kernel data is located at 0x9F74, which we can find in IORegistryDescriptorC5 class definition.
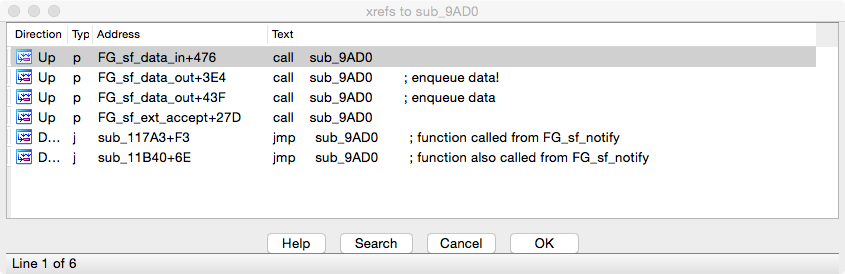
Computing the offset in the class definition we get a value of 0x970, which we can use to locate callers of this method by searching for this offset in the disassembly. Only the method at address 0x9FC0 (another method of this same class) uses this offset for calls. Now searching for offset 0x978 since it is the next method in the class, there is only one interesting hit, at function sub_9AD0. Looking at its code references we see it being called by some of the socket filter’s callbacks.
We can use the ioreg cmd line utility to verify who is using this service. Only Little Snitch Daemon has connections — five, to be precise.
We can peek at the data being sent by adding a breakpoint in the enqueue method. I am not going to describe it here.
One thing is missing from this analysis: how is the data sent when a connection is initiated?
We have seen that code references to the data enqueue don’t have the connect_* socket filter references. The connect_out callback is the first hit we get after the attach callback when we try to connect somewhere.
There is a function at address 0x1A10 that is responsible for this, as I have tested to skip and play with its return results. The function is huge with many calls to other functions so I haven’t fully reversed it yet. It references the following source code file /Users/karl/Developer/PrivatProjects/Snitch/LittleSnitch/LSKernelExtension/Allow.c so this looks like a pretty good candidate. Looking at its references we see the data socket filters are also using it.

The reason for this is that if the rule is deleted after a connection was authorized and established this will trigger a new user approval request, which is obviously a good design.
One thing I know is that connect_out filter is not using the sub_9AD0 function (that will enqueue data) because if we patch the call to enqueue data there the alert will still show up. After writing these paragraphs, my curiosity flared and I decided to try once more to find how the data is sent to user application on new connections.
I decided to trace which methods were called from the user clients. This can be done by breakpointing the externalMethod() method at address 0xDC6A and examining each value in the RSI register (which is the current method number). Two interesting methods are used when a new connection is created, 6 and 7. Since method 7 has more hits let’s start with it. The code is small and doesn’t contain much of interest except a call to function at address 0x14F4. This is a structure output method, with a a structure 0x83C bytes long — quite a significant amount of data.
What this function does is copy values from an internal structure to the (different) output structure. We determine the meaning of the output structure with a kernel debugger to get the following (incomplete) definition:

The path explains the large size of the structure and if we modify its contents in a kernel breakpoint we will get the modified information displayed in the user alert. Clearly this is the code where information is sent to the user application. Let me remind you that these methods are user application initiated so contrary to my previous statement there is indeed some kind of polling from the user applications about new connections. Now it is interesting to understand how this is implemented.
There is an important clue here:
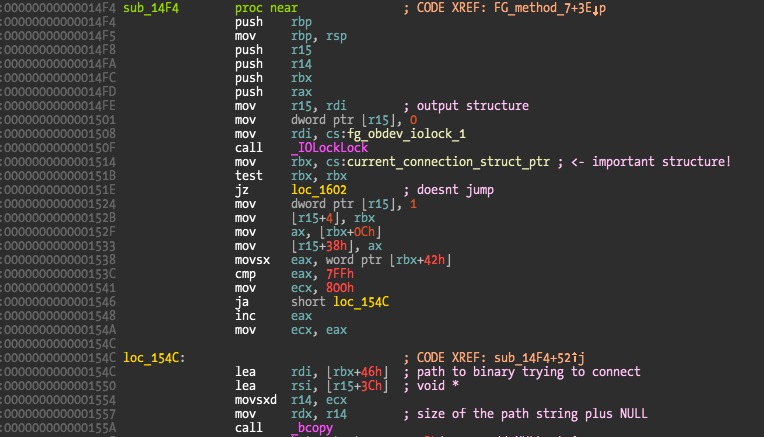
What I label as current_connection_struct_ptr is where the trick is. It is a pointer to a structure that contains information about the new connection. After some tests we observe that this variable has two states, a value of zero (meaning no new connection) and a pointer to an allocated memory structure (experiment with different connections and we get different values there).
My hypothesis is that this implements a serial queue design to guarantee that there is guaranteed synchronization between a new connection and user decision. Queueing events wouldn’t bring any improvement since the user has to make a decision case by case.
I tried to find where that pointer was being set to confirm that this happens somewhere inside the big function at 0x1A10 (the one I called FG_call_userland_decision). There were a few references but the breakpoints would never trigger there. The reason is that there is another pointer after current_connection_struct_ptr that points back to it, and that is the one used to update with new connections. And here is where the new connection is set and made ready for user application to grab via method 7.
To complete the theory that it was a memory allocated structure we need to find where the value in R14 was initially set. We need to go way back in the code to this point:
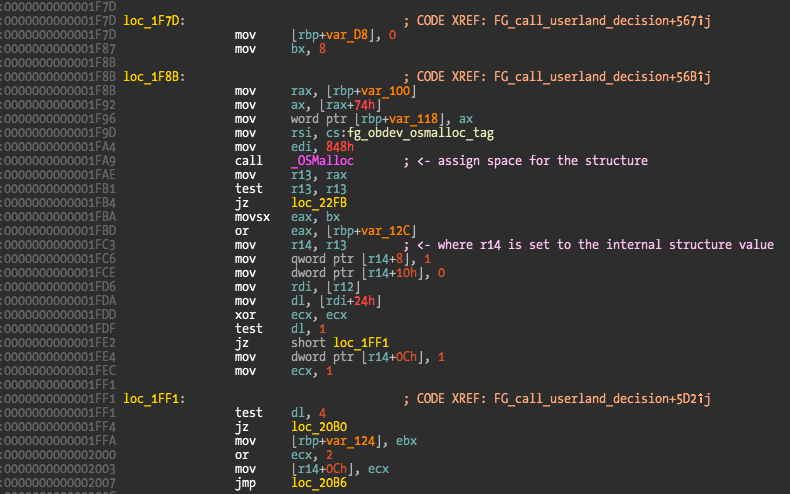
If you breakpoint here, and compare the allocated pointer with the one being copied from method 7 you will see that they match. So it is starting to make sense that when I patch 0x1A10 to not execute, nothing happens in the user application – no data is created about the new connection.
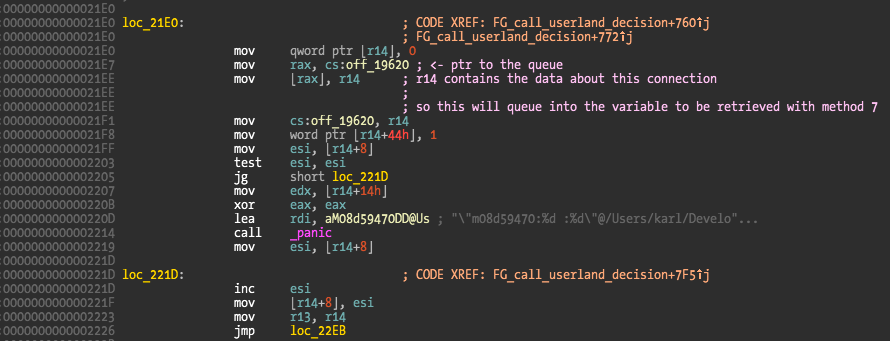
And finally the last piece of this puzzle! If method 7 is used to retrieve information about the new connection, how does the user application know when to execute it without polling? A breakpoint on method 7 is only triggered when a new connection happens, so there is no polling. The answer lies a bit forward in the same 0x1A10 function.
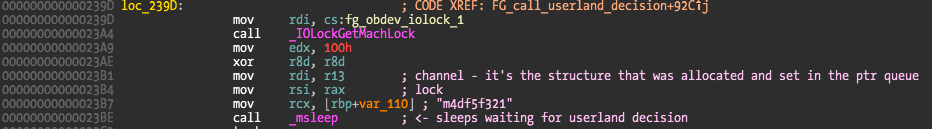
The kernel thread will sleep waiting for modifications on the structure pointer. This is the moment when the kernel is waiting for the user to make a decision about the current new connection. When the decision is made the kernel thread will resume. This still doesn’t explain the lack of polling. The answer is a few bytes before this previous code snippet.
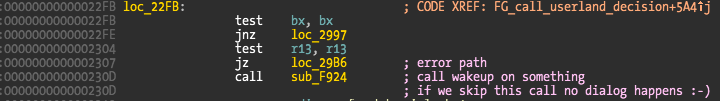
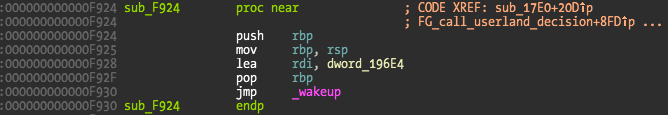
The only argument wakeup() receives is the channel, in this case a pointer to address 0x196E4. This means the function will wakeup some kernel thread that was sleeping with msleep().
If we look at the references to the channel we get a data reference to the function responsible for sending that thread into sleep.
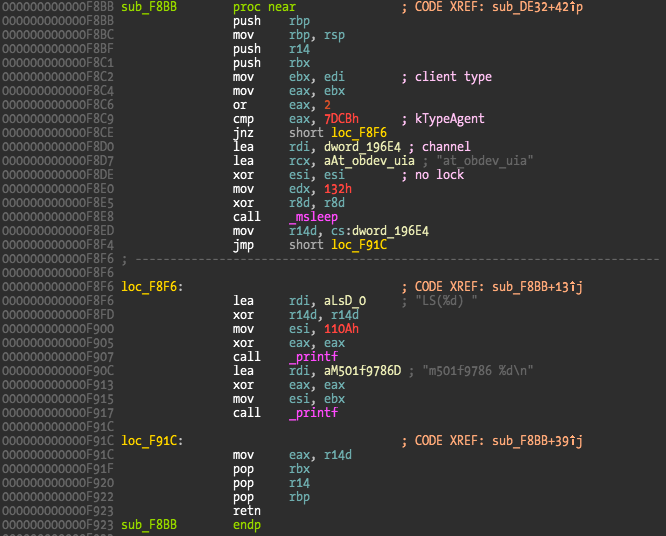
This function sub_F8BB is referenced by method at 0xDE32, which is one of the Little Snitch methods defined on class IORegistryDescriptorC1, and called by method number 6, which explains why we saw this method when tracing new connections. The puzzle is finally solved!
What happens is that Little Snitch Daemon uses method 7 to retrieve the new connections data from the kernel, and then uses method 6 to signal it has all the data it needs, sending its respective thread into sleep. When a new connection happens, the kernel will signal the daemon thread that is waiting for notifications to wake up, and then the daemon once more executes method 7 to retrieve the new connection data. While the user is making a decision, the kernel thread corresponding to the new connection sleeps until there is a response, so the application thread execution is blocked until there is a Little Snitch response (or timeout).
We observe what happens in the user application by taking a sample of the Little Snitch Daemon:
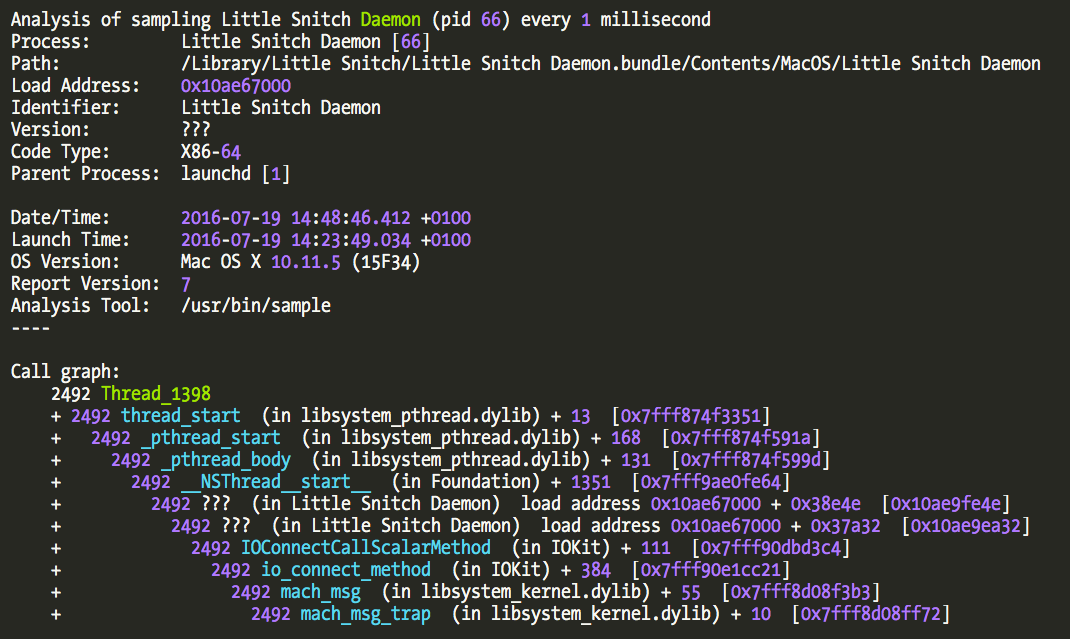
The 0x10ae9ea32 address (ASLRed address!) in the sample is the function where Little Snitch Daemon executes method 6. This function is called from a method named waitNotificationLoop:, which contains next a call to another method called newKextNotification.
The mystery is finally solved and we can see how Little Snitch guarantees the serial decision on each new connection and guarantees that processes can’t do anything with connections until the user makes a decision (assuming no bypass vulnerabilities).
In theory IODataQueue could be used for this task, but I think this design is still present because it was devised before IODataQueue became available.
I left one thing out of this analysis, which is what happens for rules that are temporary or permanent. Either the kernel has a cache of those rules to avoid querying the rules in userland, or it does query userland every on every connection (which doesn’t sound very performant). For example, when a rule is deleted there is a method executed by user applications, which is an interesting clue to understand this process.
Conclusion
Finally the end of a very long and interesting reverse engineering blog post. We have reversed some of Little Snitch kernel component internals and design, and disclosed two vulnerabilities, a critical one that allows to bypass or disable Little Snitch protection, and a simple denial of service that will just hang or kernel panic the host machine.
Little Snitch developers Objective Development already released version 3.6.4 with fixes for both problems. Hat tip to them for the quick fix turnaround and pleasant no-drama email exchange regarding these issues. You should update your copy of Little Snitch as soon as possible.
Naturally people will wonder if they should use Little Snitch or not, since the reality is that it increases the (potential) attack surface. This is not an easy question to answer. Personally I still think it is a very useful piece of software and I will remain a user. Like every piece of software (and more important security software) it needs (external) audits. Users should not assume that security software has received security scrutiny, which is a very common assumption. It is practically impossible for Objective Development to open-source their product (look at the amount of people trying to pirate it!) but now you have a better understanding of its internals, so you can grab your disassembler and debugger and continue to audit this software.
Hope you have enjoyed this!
Have fun,
fG!