Happy New Year and happy ten year anniversary to this blog, which I totally forgot back in October :-/. Blogging activity here has been so slow that I almost forgot how to work with Hugo.
We started 2018 with heavy speculation on critical CPU bugs that were under disclosure embargo. Luckily for us, Google decided to break the embargo and release some proper information about the bugs so speculation could stop and facts could finally flow in. The merits or not of disclosure embargos deserve a serious discussion but this post is not the place for it. This one was for sure a huge mess.
The world was finally introduced to Meltdown and Spectre.
One of the more interesting rumours was about the performance impact of the security features implemented by Linux to workaround these bugs, in particular the mitigations against Meltdown (CVE-2017-5754). My economist and system administrator side got interested into this because there was almost no performance data available. It is interesting and necessary to measure the patch impact to fully understand its consequences. Yes, security is important, but if my whole business goes down because of the performance hit then the security might have to wait some time. No cash flows, no salaries, no business. Always keep this in mind.
On January 5th Apple disclosed that both its Intel and ARM systems (read OS X and iOS) were vulnerable to Meltdown and Spectre, and that patches were already released with High Sierra 10.13.2, iOS 11.2, tvOS 11.2. Regarding Meltdown performance impact they wrote:
Our testing with public benchmarks has shown that the changes in the December 2017 updates resulted in no measurable reduction in the performance of macOS and iOS as measured by the GeekBench 4 benchmark, or in common Web browsing benchmarks such as Speedometer, JetStream, and ARES-6.
There is a funny story about the patch in High Sierra 10.13.2. My SentinelOne colleague Julien-Pierre detected a crash in our kernel extension with a 10.13.2 beta release. I started looking at the issue and the reason was that we were still using the IDT table to locate the kernel image in memory. The Meltdown patch introduces changes in IDT to improve the memory separation between kernel and user apps (the Meltdown vulnerability). I didn’t pursue reverse engineering the whole thing but I had a feeling at the time they were trying to separate kernel and user spaces. I thought Apple was experimenting with some new exploit mitigation strategy. Now with hindsight it is easier to look at the changes :-).
Anyway, I decided to make a series of tests to measure the impact of the 10.13.2 patch. Benchmarking is not an easy task and the initial reports of different impacts depending on the workloads doesn’t make the problem easier. So my assumption was to try to measure one extreme - pure system call (syscall hereafter) performance - and some mundane tasks - compiling XNU kernel, unpacking Xcode 9.2, and run GeekBench 4 to reproduce Apple results.
The general conclusion points toward a real performance loss with High Sierra 10.13.2. This result was expected because of the engineering behind the patch and other operating systems initial reports. The syscall results are somewhat atrocious with 2 to 4 times increases in total execution time. This at “face” value looks really bad and some workloads will definitely suffer, hence the need to measure the impact for each specific scenario. But OS X and iOS are mostly desktop type operating systems and so the impact is somewhat smoothed because they aren’t executing millions of syscalls as fast as possible as my tests did. Yes it sucks, we just lost a certain amount of computing power in the space of a week, and for some people there is even real financial impact - some cloud users experienced higher CPU usage which will translate into higher costs.
Some links about performance impacts in other operating systems:
- Initial Benchmarks Of The Performance Impact Resulting From Linux’s x86 Security Changes
- DragonFlyBSD mailing list post about fix and performance impact.
- Further Analyzing The Intel CPU “x86 PTI Issue” On More Systems
- Twitter post about AWS ECS hypervisor CPU usage increase.
- Epic Games complaining about backend increased CPU usage
At least in OS X there is no much drama with the update, there are trade-offs that system administrators and users need to measure, understand, and accept or reject in cases where it is possible.
Setup
The tests were made with the following machines:
- MacBook Pro 8,2 - 2Ghz 4 Core i7 - 16 GB RAM - Corsair Neutron GTX 240 GB SSD
- Mac Pro 6,1 - 3,5 Ghz 6 Core Xeon E5 - 32 GB RAM - 256 GB SSD
The MacBook Pro appears on charts as MBP and the Mac Pro as MP. Both have the PCID CPU feature (and XNU uses it in pmap_pcid_configure). If you make the tests in different machines (newer) and the results differ in conclusions please drop me an email with the results.
OS X versions used:
- Sierra 10.12.6, builds 16G1114 (MacBook Pro), 16G1036 (Mac Pro)
- High Sierra 10.13.0 (17A365), 10.13.2 (17C89)
The 10.13.2 supplemental update was just released and has a new build number 17C205 but the kernel hasn’t changed versus 17C89.
The filesystem was HFS+ in Sierra, encrypted in the Mac Pro and not encrypted in the MacBook Pro, and unencrypted APFS in High Sierra.
Other software:
- Geekbench 4.2.0
- Xcode 9.2
- Nasm 2.13.02
You can find the source code used for syscall benchmarking here.
Unless explicit, all the results except Geekbench are total seconds to complete the test.
Benchmarks
Geekbench 4
Let’s start with the easiest test, Geekbench 4.
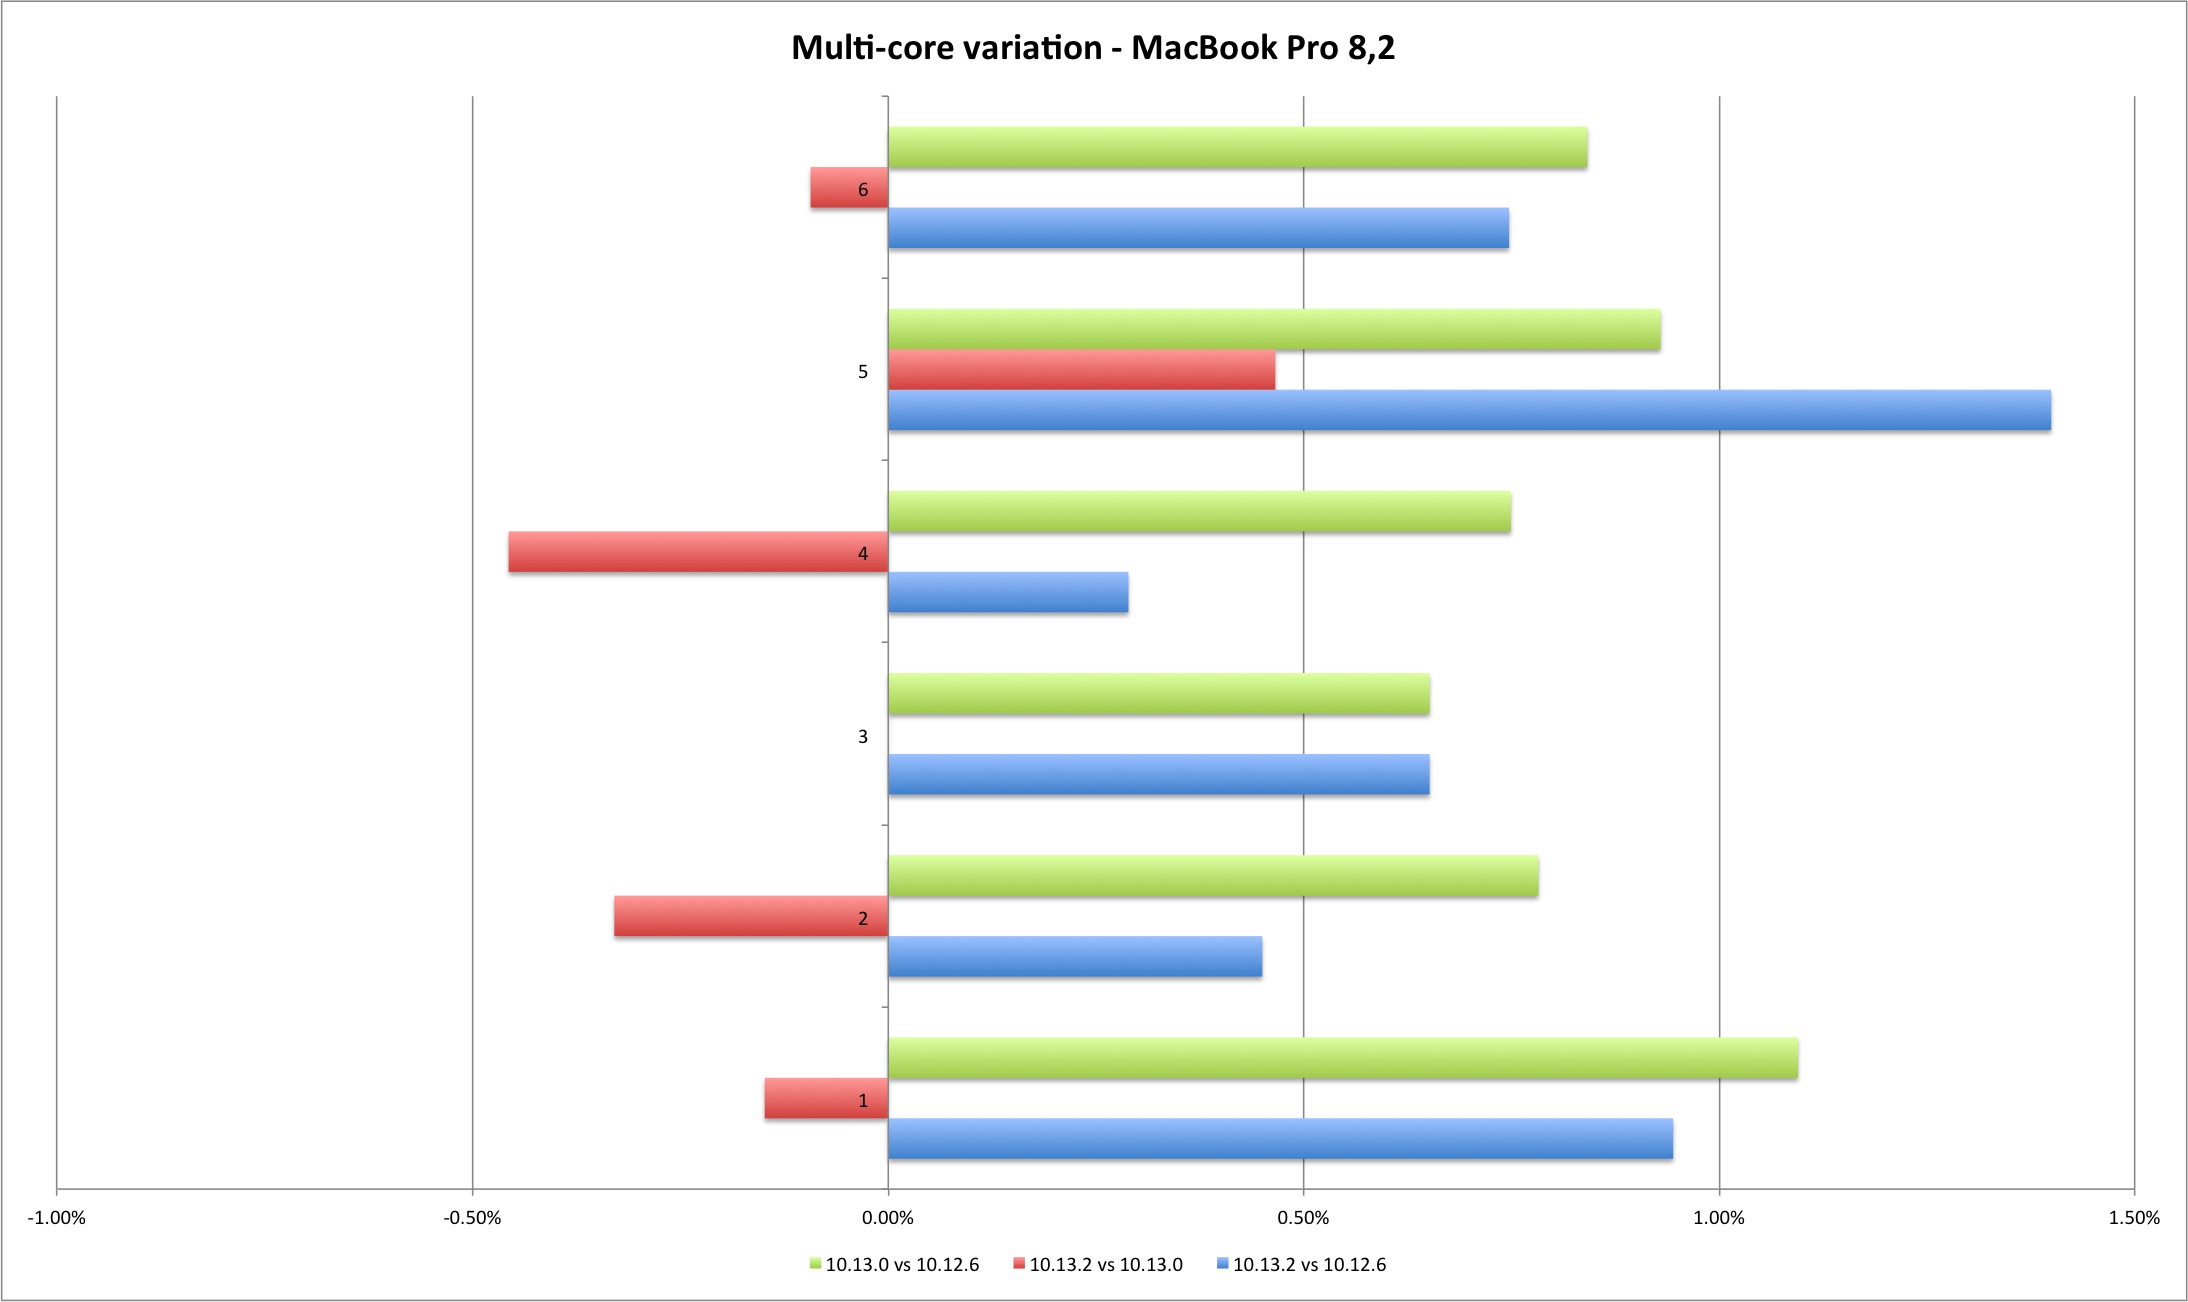
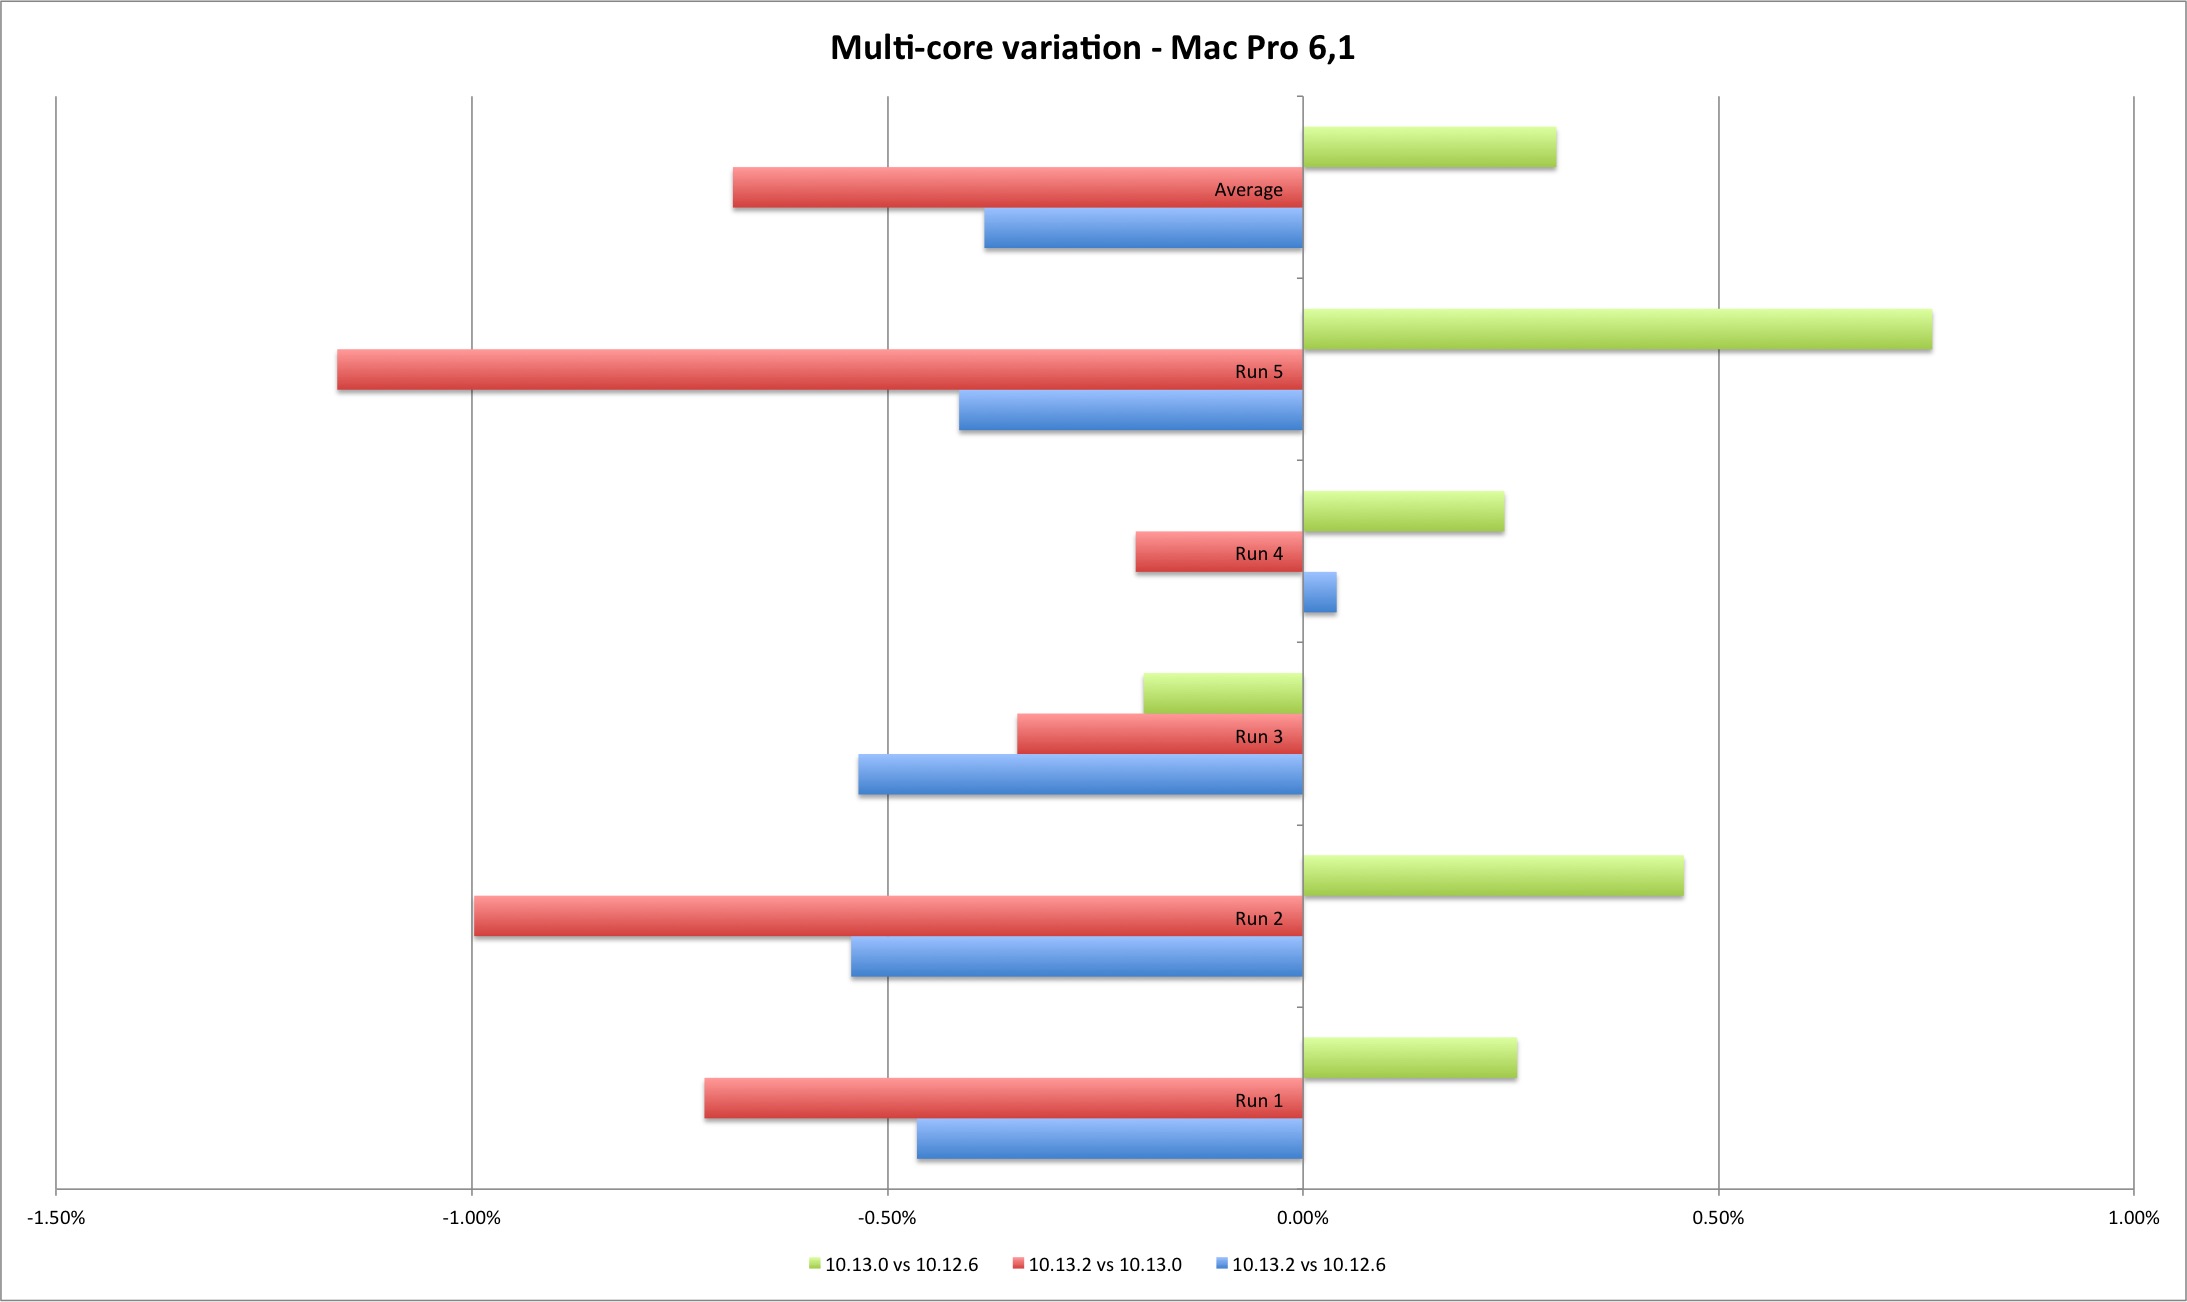
The results are a bit different between the MacBook and the Mac Pro (their CPUs belong to different classes) but the key takeaway is that the variation amount between the different versions is in practice irrelevant (the run #2 MacBook outlier can be ignored).
The multi-core performance degradation in the Mac Pro can be up to 1% but the initial release of High Sierra improved the score over Sierra, and in the case of the MacBook the results improved from Sierra to High Sierra and 10.13.2 loss isn’t conclusive.
These are Geekbench single-core results, five runs on each machine and different OS X versions.
| Single Core | MBP 10.12.6 | MBP 10.13.0 | MBP 10.13.1 | MBP 10.13.2 |
|---|---|---|---|---|
| Run 1 | 2957 | 2955 | 2955 | 2963 |
| Run 2 | 2957 | 2697 | 2968 | 2969 |
| Run 3 | 2955 | 2948 | 2977 | 2963 |
| Run 4 | 2958 | 2960 | 2969 | 2957 |
| Run 5 | 2954 | 2944 | 2972 | 2964 |
| Average | 2956,2 | 2900,8 | 2968,2 | 2963,2 |
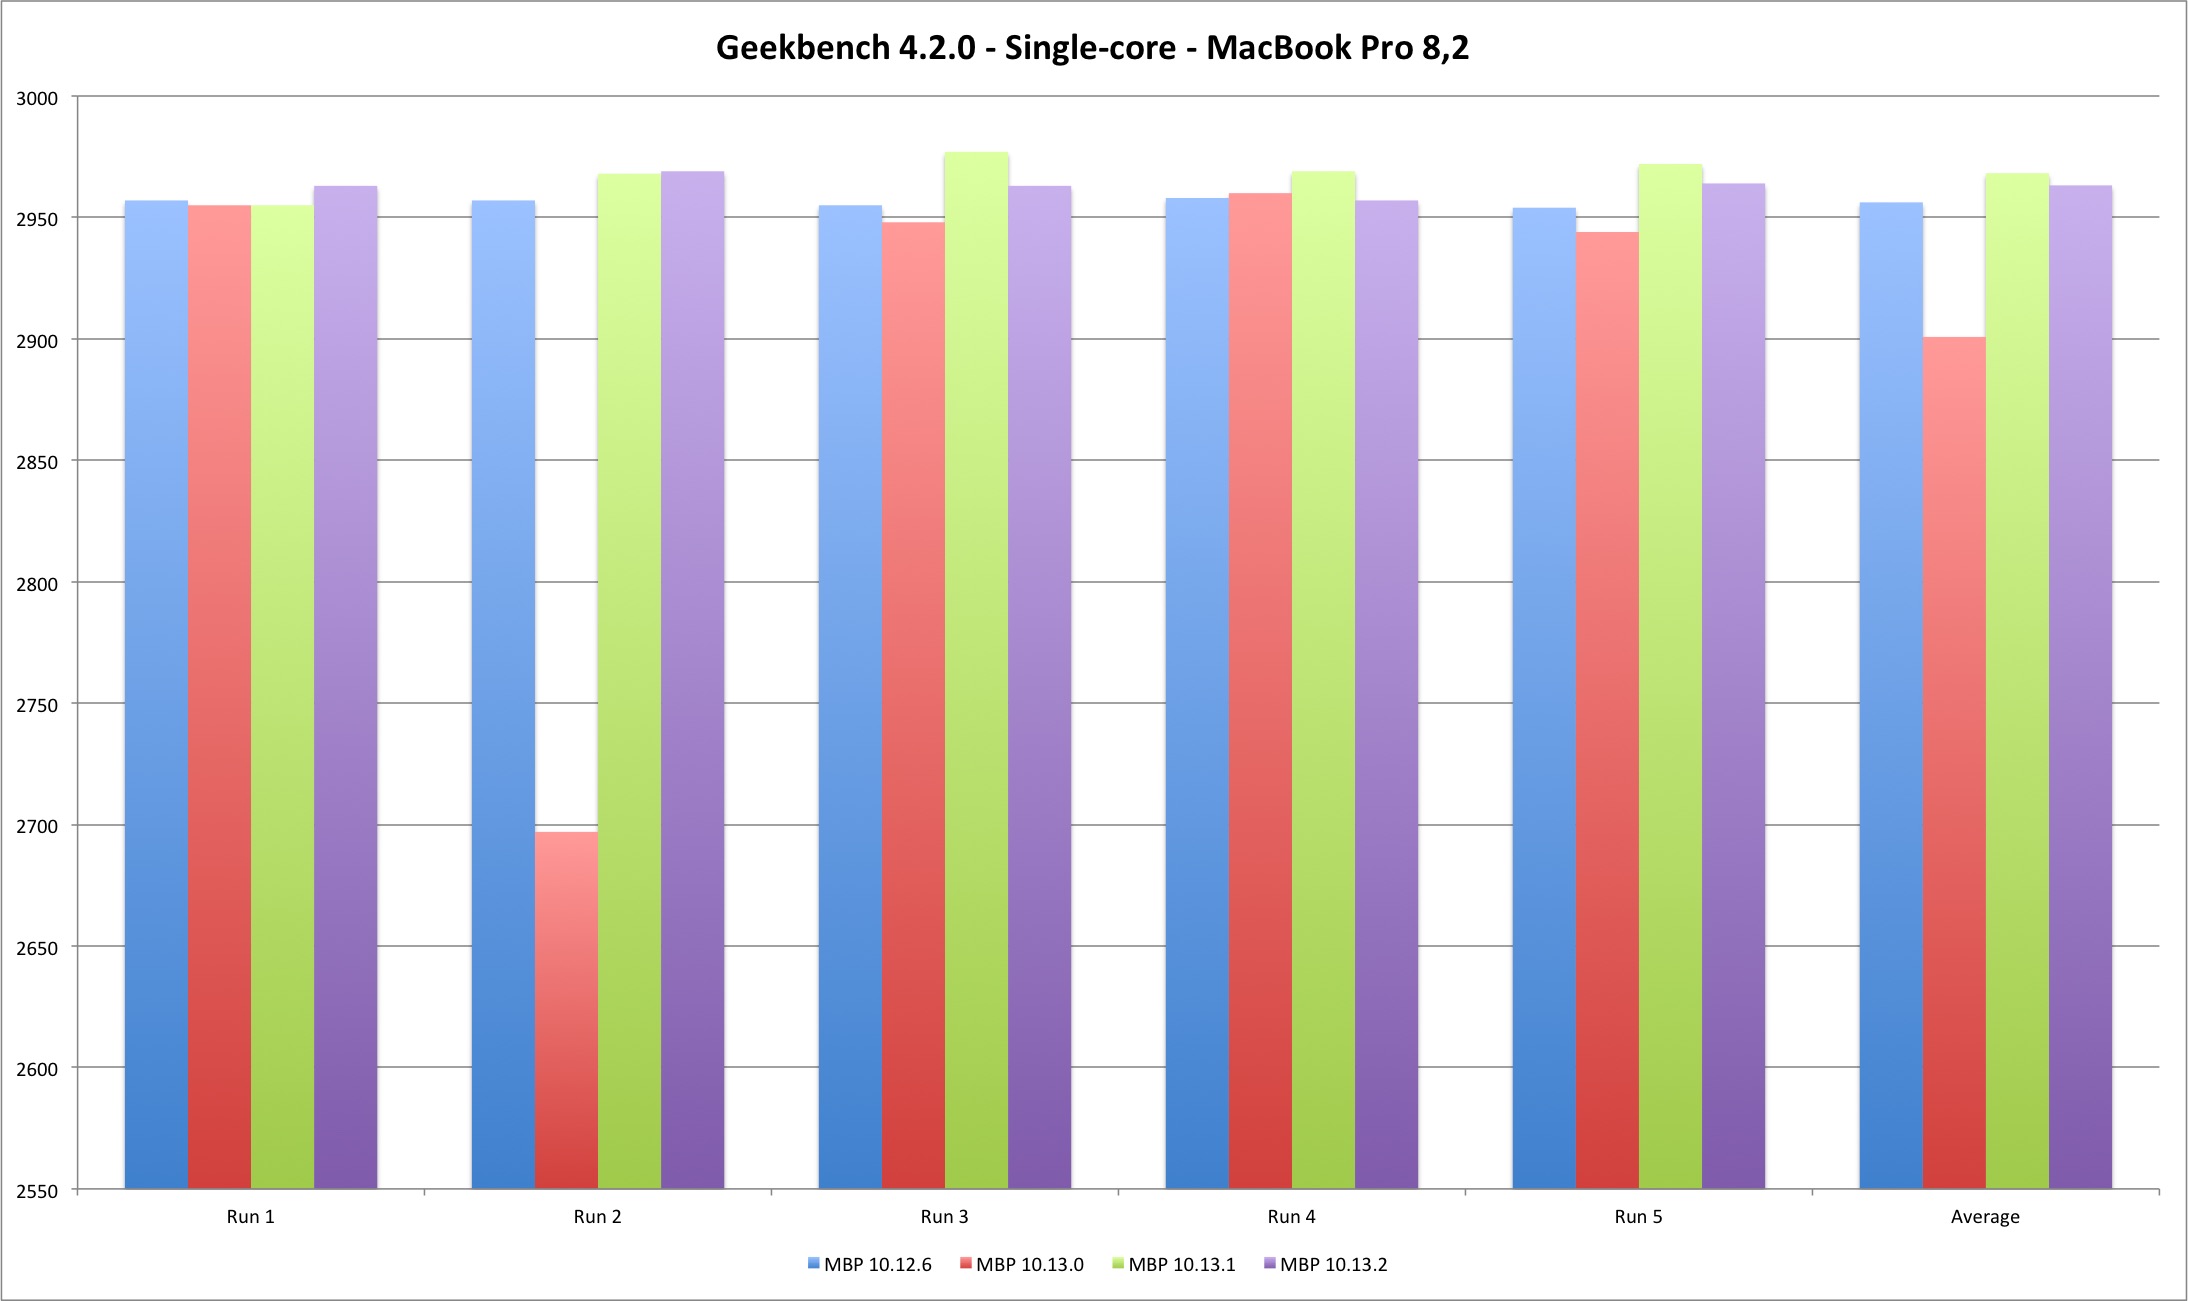
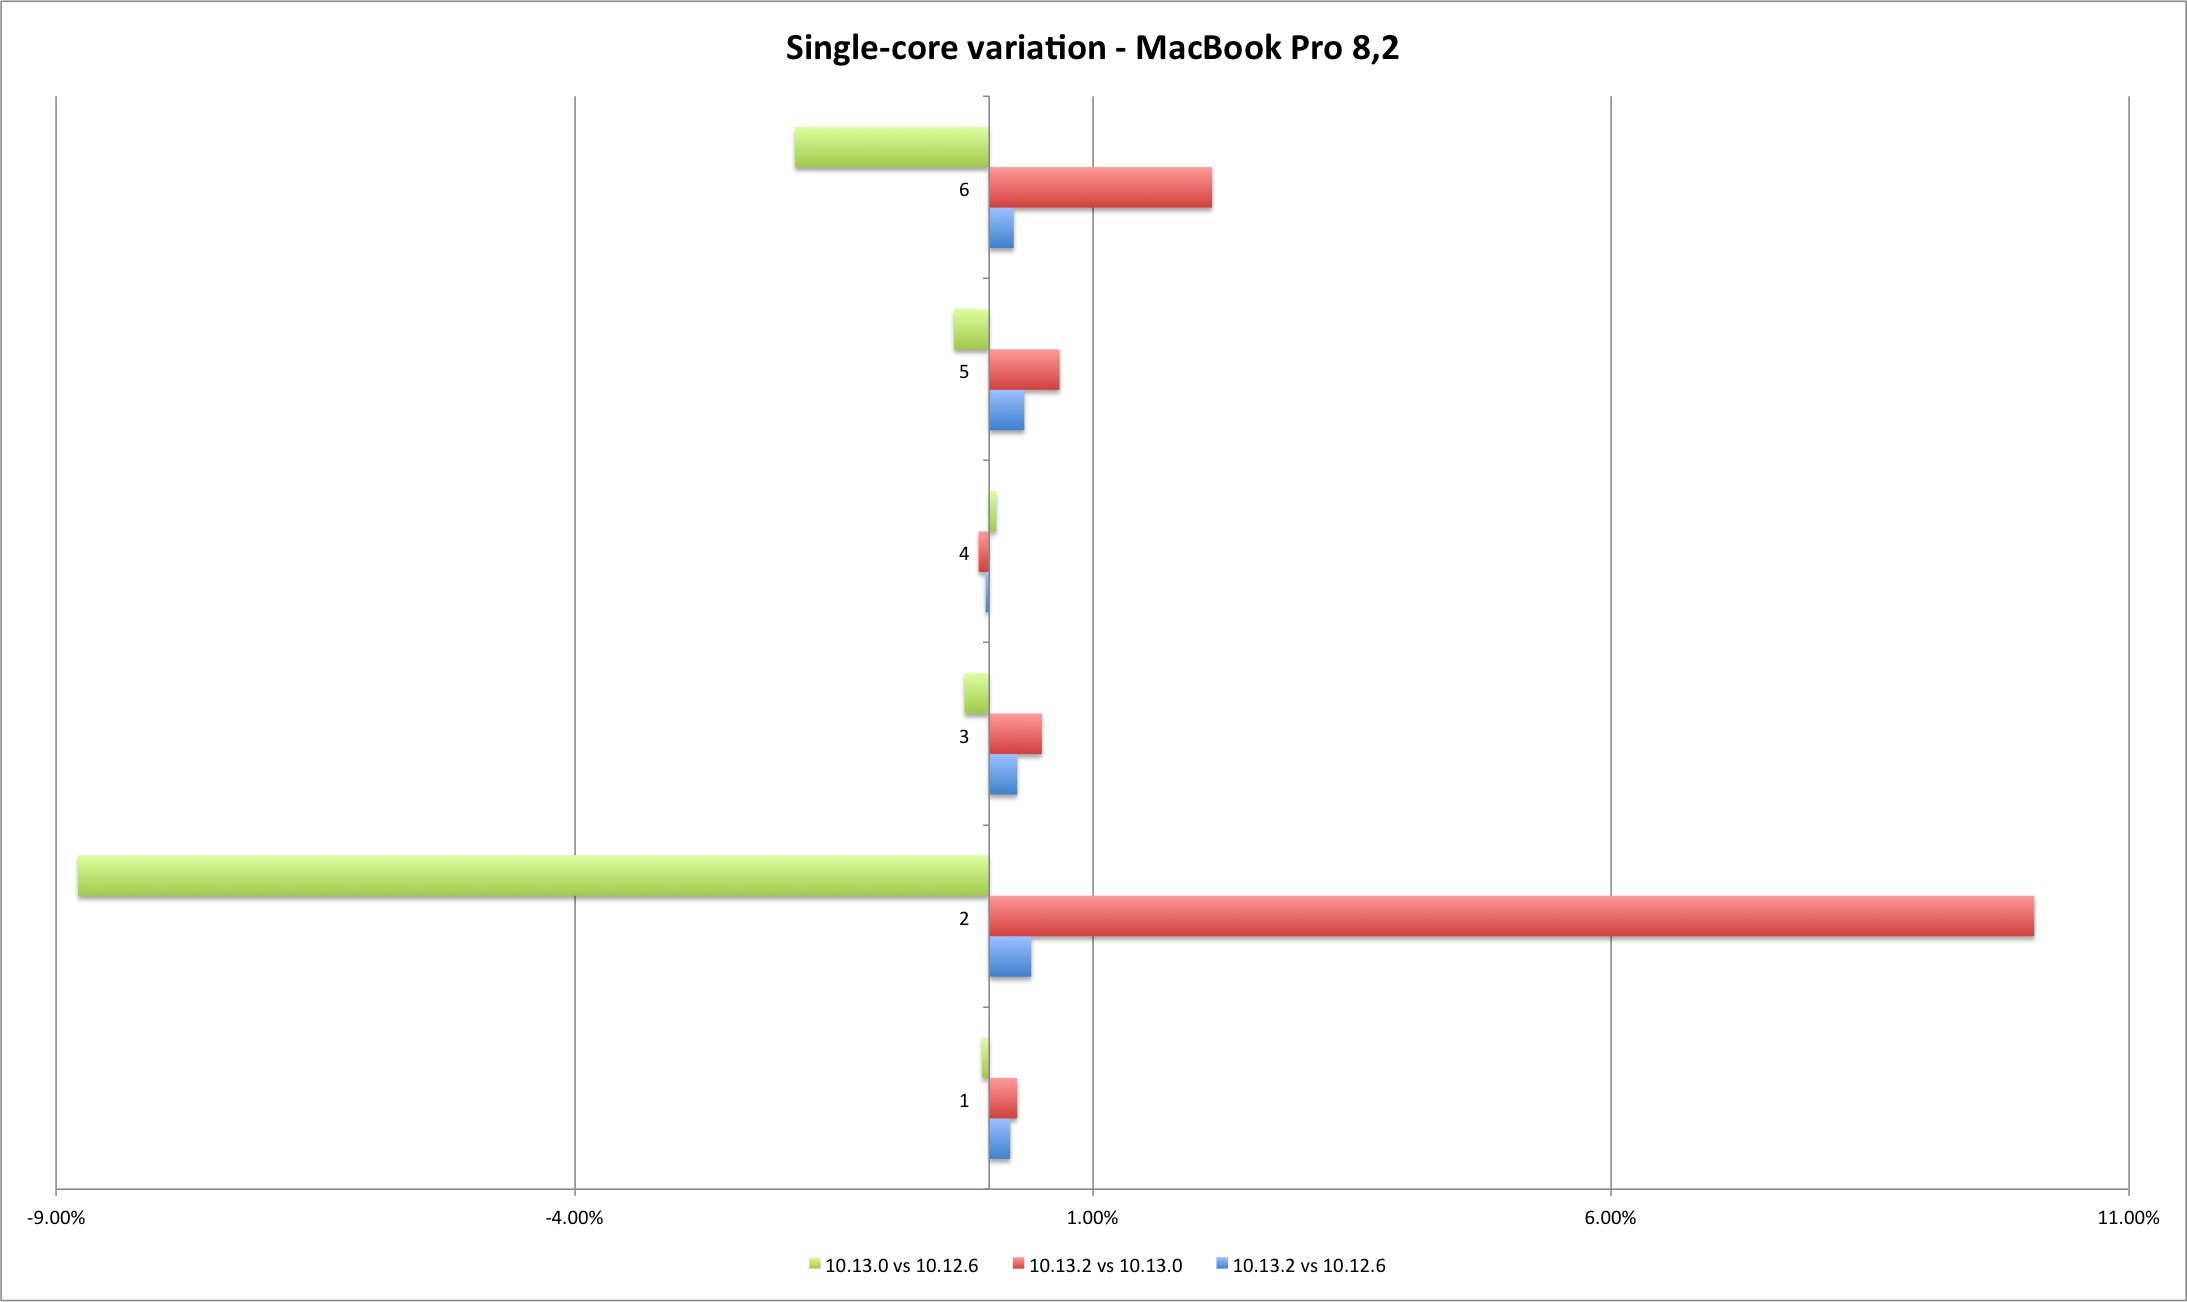
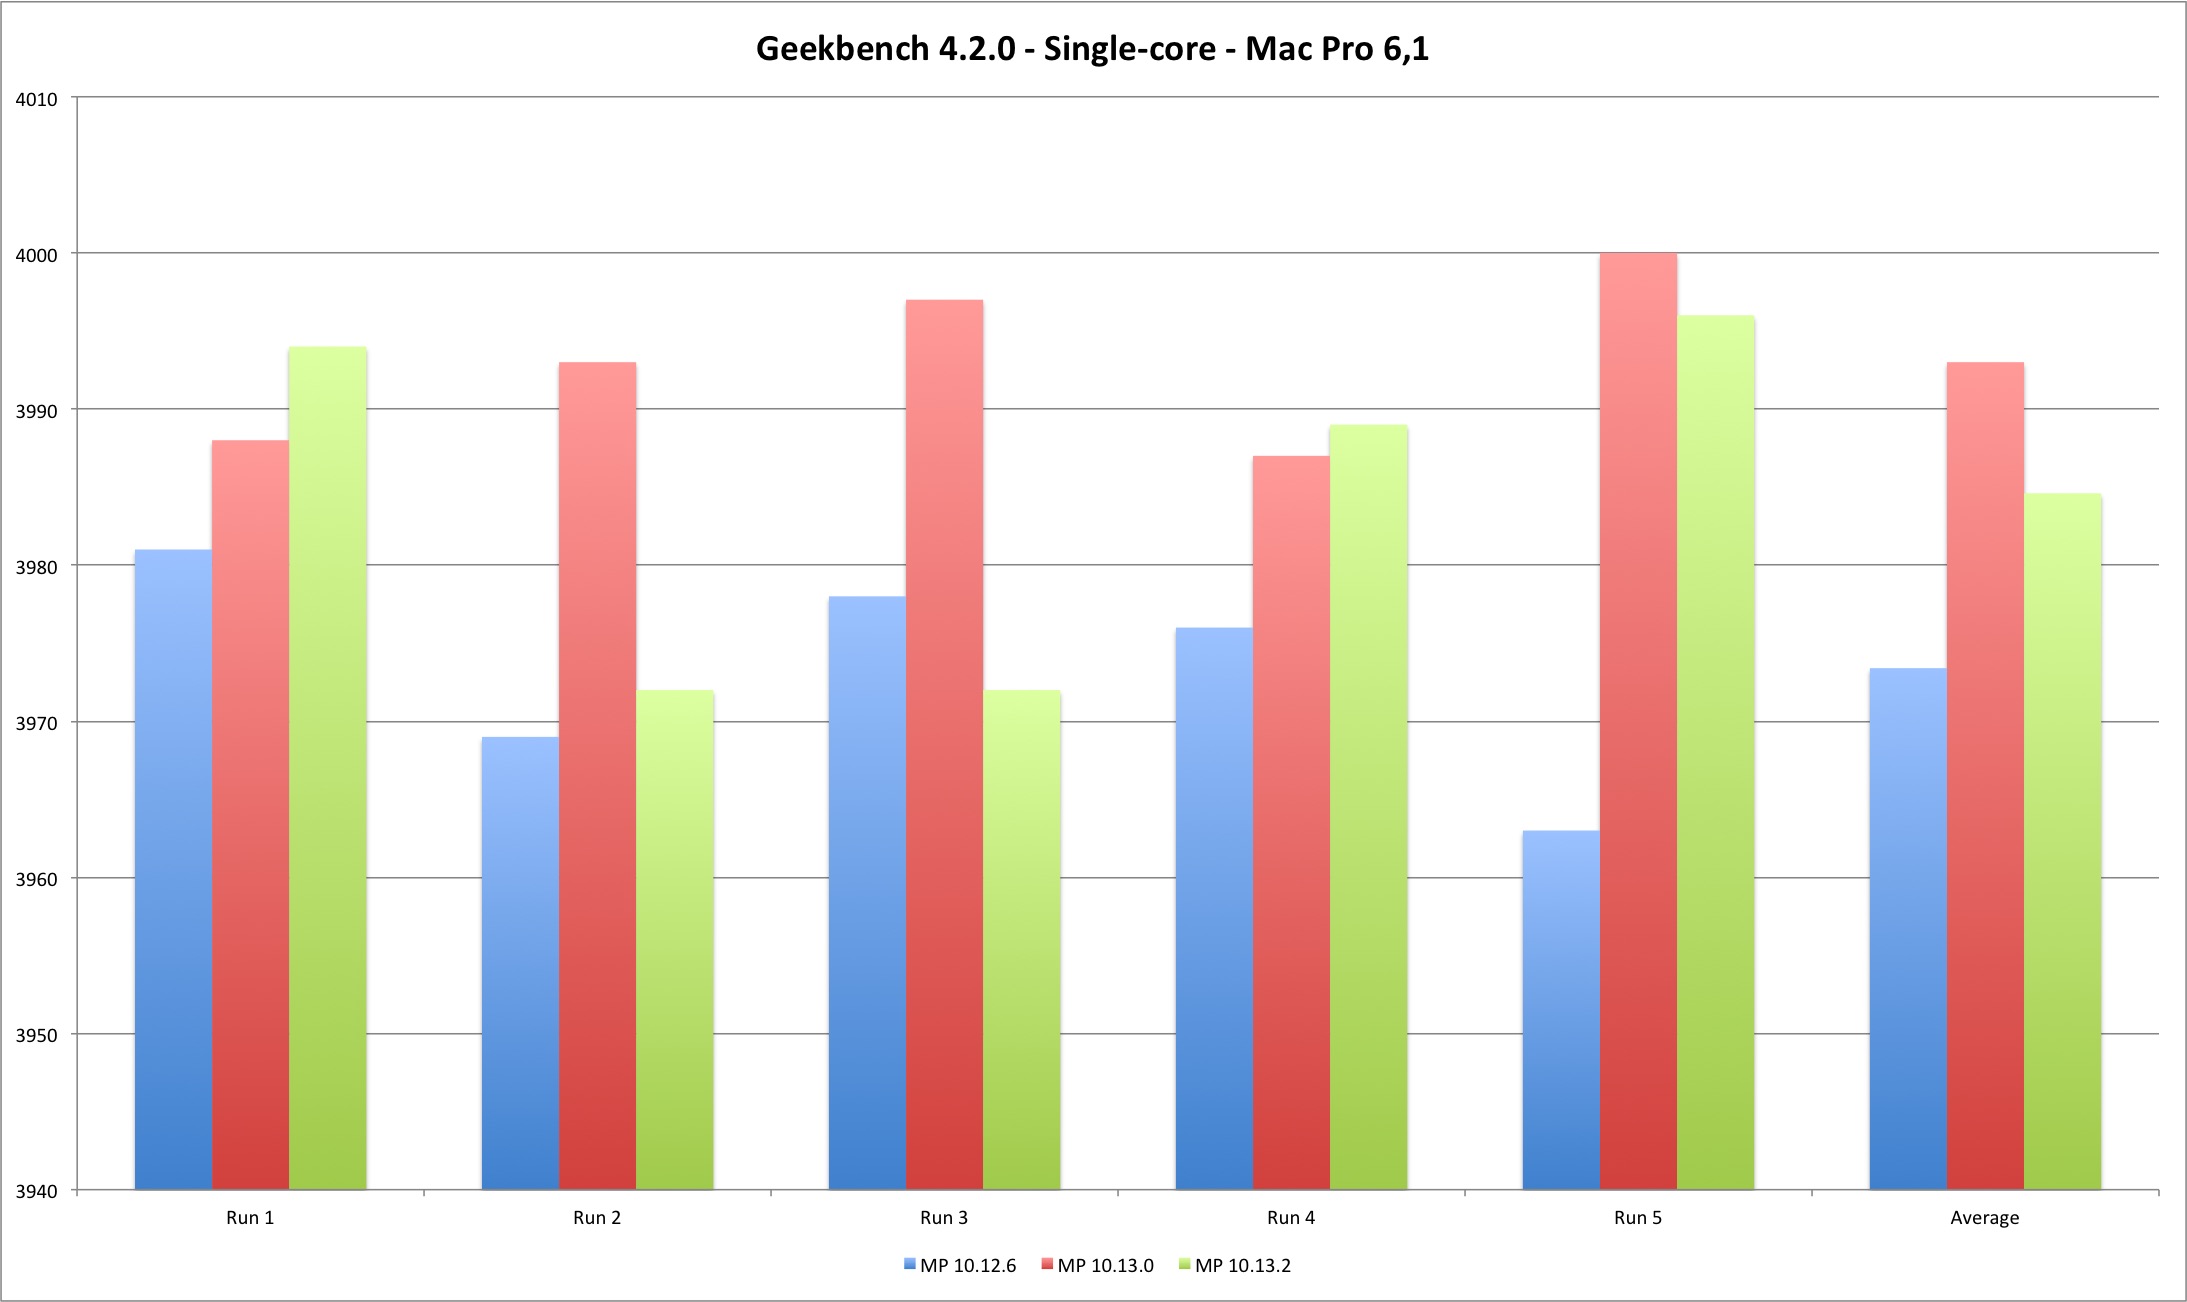
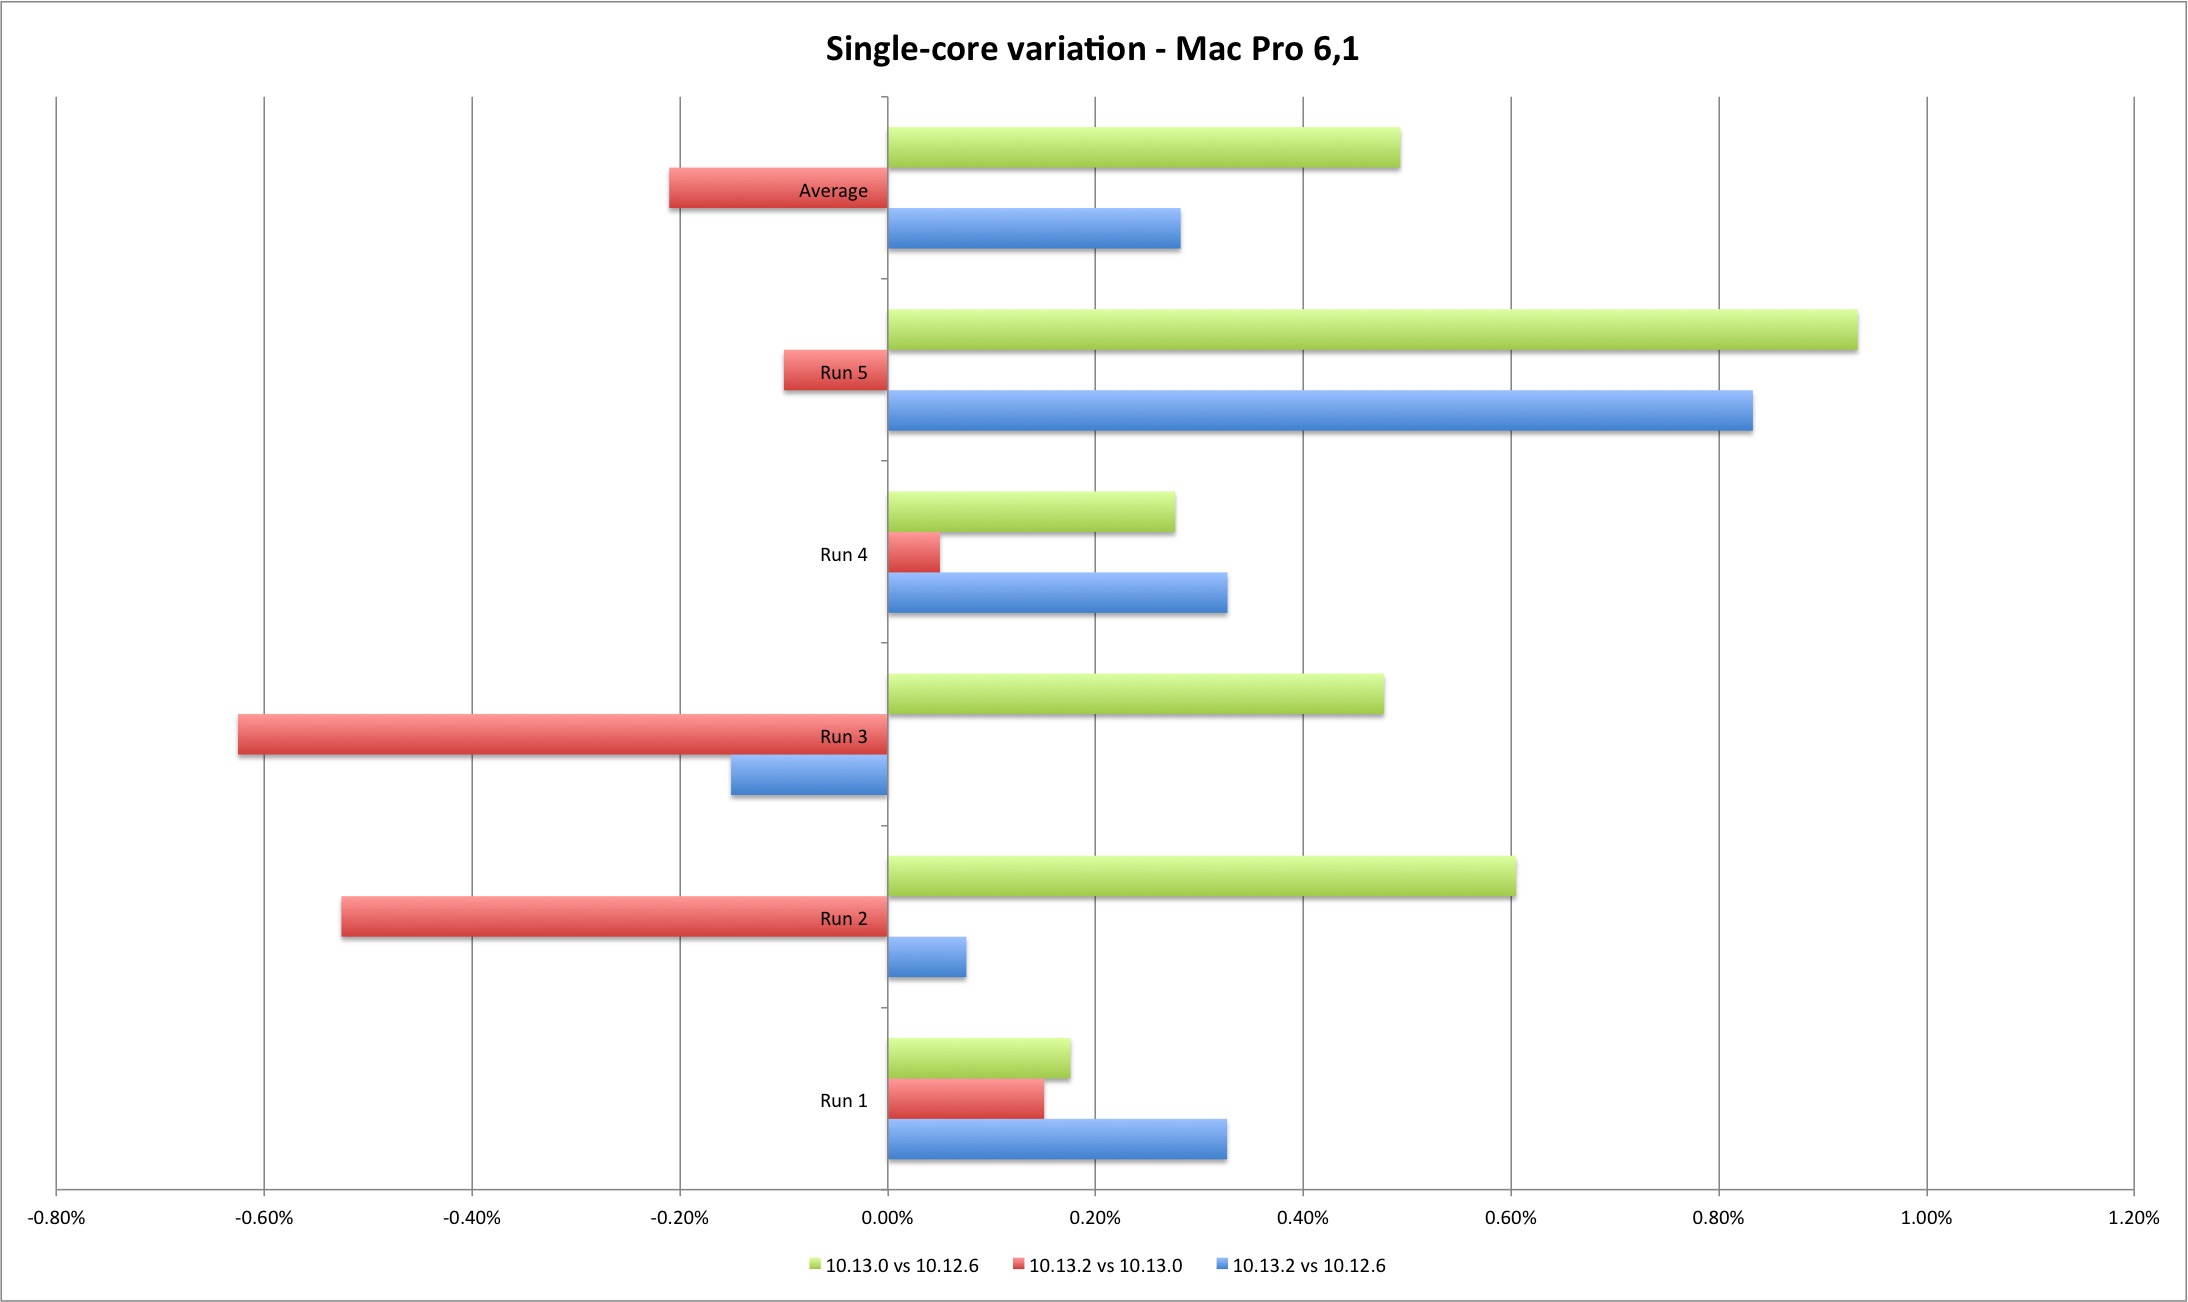
The MacBook Pro single core performance doesn’t vary much, except for those two outliers, both on 10.13.0. But the Mac Pro displays a different picture - the single core performance improved from Sierra to High Sierra. Between High Sierra versions there is no conclusive direction but the performance loss is minimal. The positive variation means that Geekbench scores improved with the new version, and negative that they got worse.
| Single Core | MP 10.12.6 | MP 10.13.0 | MP 10.13.2 |
|---|---|---|---|
| Run 1 | 3981 | 3988 | 3994 |
| Run 2 | 3969 | 3993 | 3972 |
| Run 3 | 3978 | 3997 | 3972 |
| Run 4 | 3976 | 3987 | 3989 |
| Run 5 | 3963 | 4000 | 3996 |
| Average | 3973,4 | 3993 | 3984,6 |
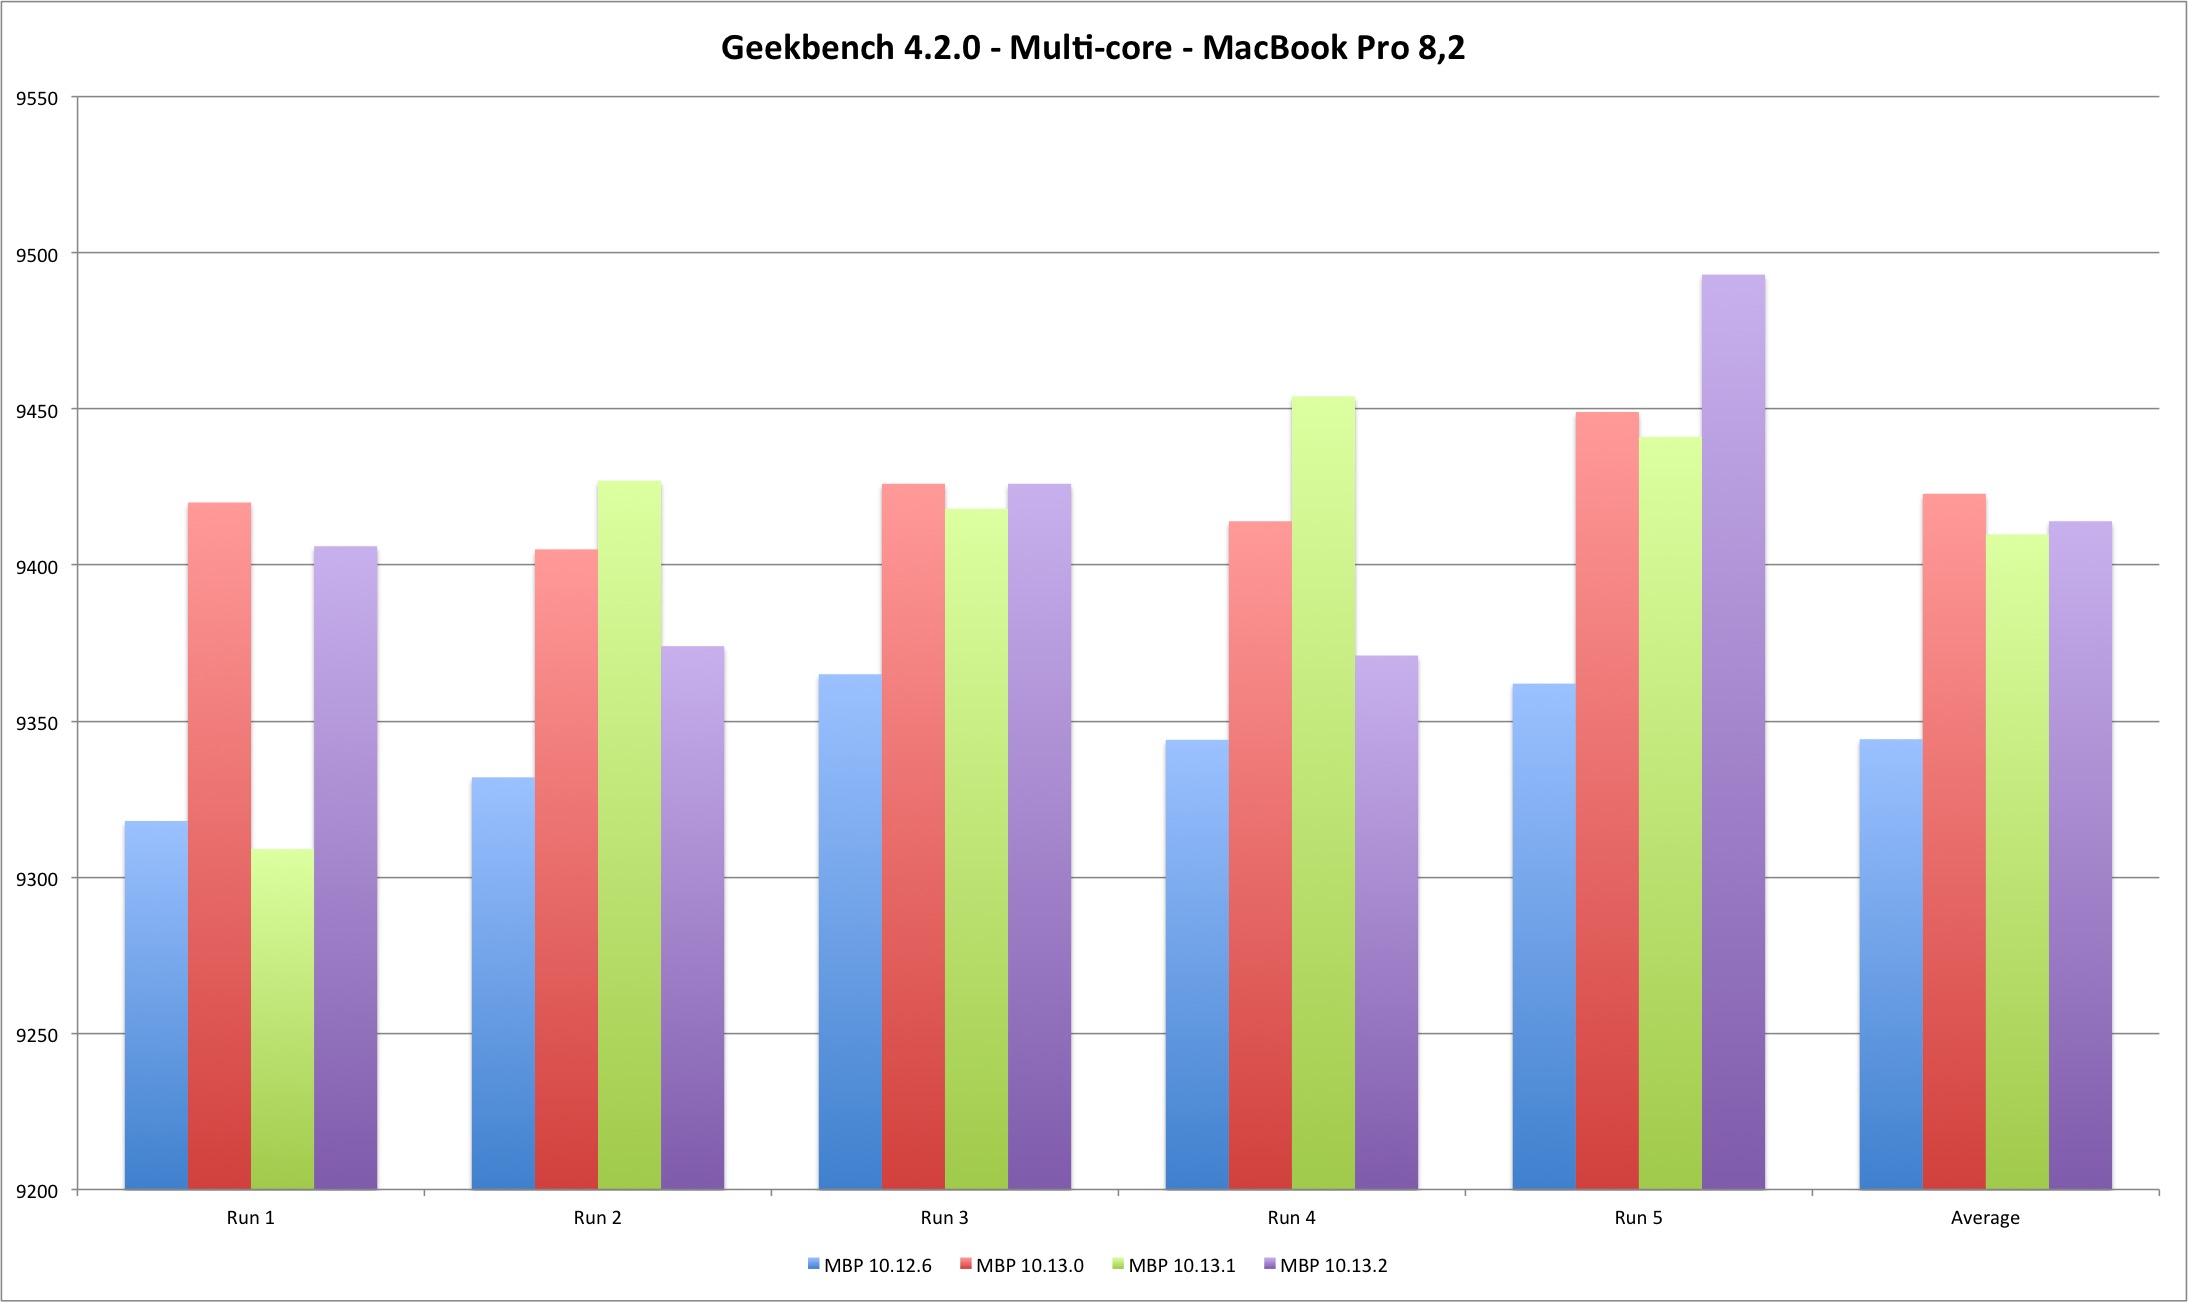
The multi-core results are slightly more interesting. For the MacBook Pro they show a performance improvement from Sierra to High Sierra and minimal performance loss between High Sierra versions. For the Mac Pro the gain is clear from Sierra to High Sierra, and a clear performance loss on 10.13.2 versus Sierra and initial High Sierra (except one case). Still, the performance loss is minimal, up to 1,40%.
| Multi Core | MBP 10.12.6 | MBP 10.13.0 | MBP 10.13.1 | MBP 10.13.2 |
|---|---|---|---|---|
| Run 1 | 9318 | 9420 | 9309 | 9406 |
| Run 2 | 9332 | 9405 | 9427 | 9374 |
| Run 3 | 9365 | 9426 | 9418 | 9426 |
| Run 4 | 9344 | 9414 | 9454 | 9371 |
| Run 5 | 9362 | 9449 | 9441 | 9493 |
| Average | 9344,2 | 9422,8 | 9409,8 | 9414 |
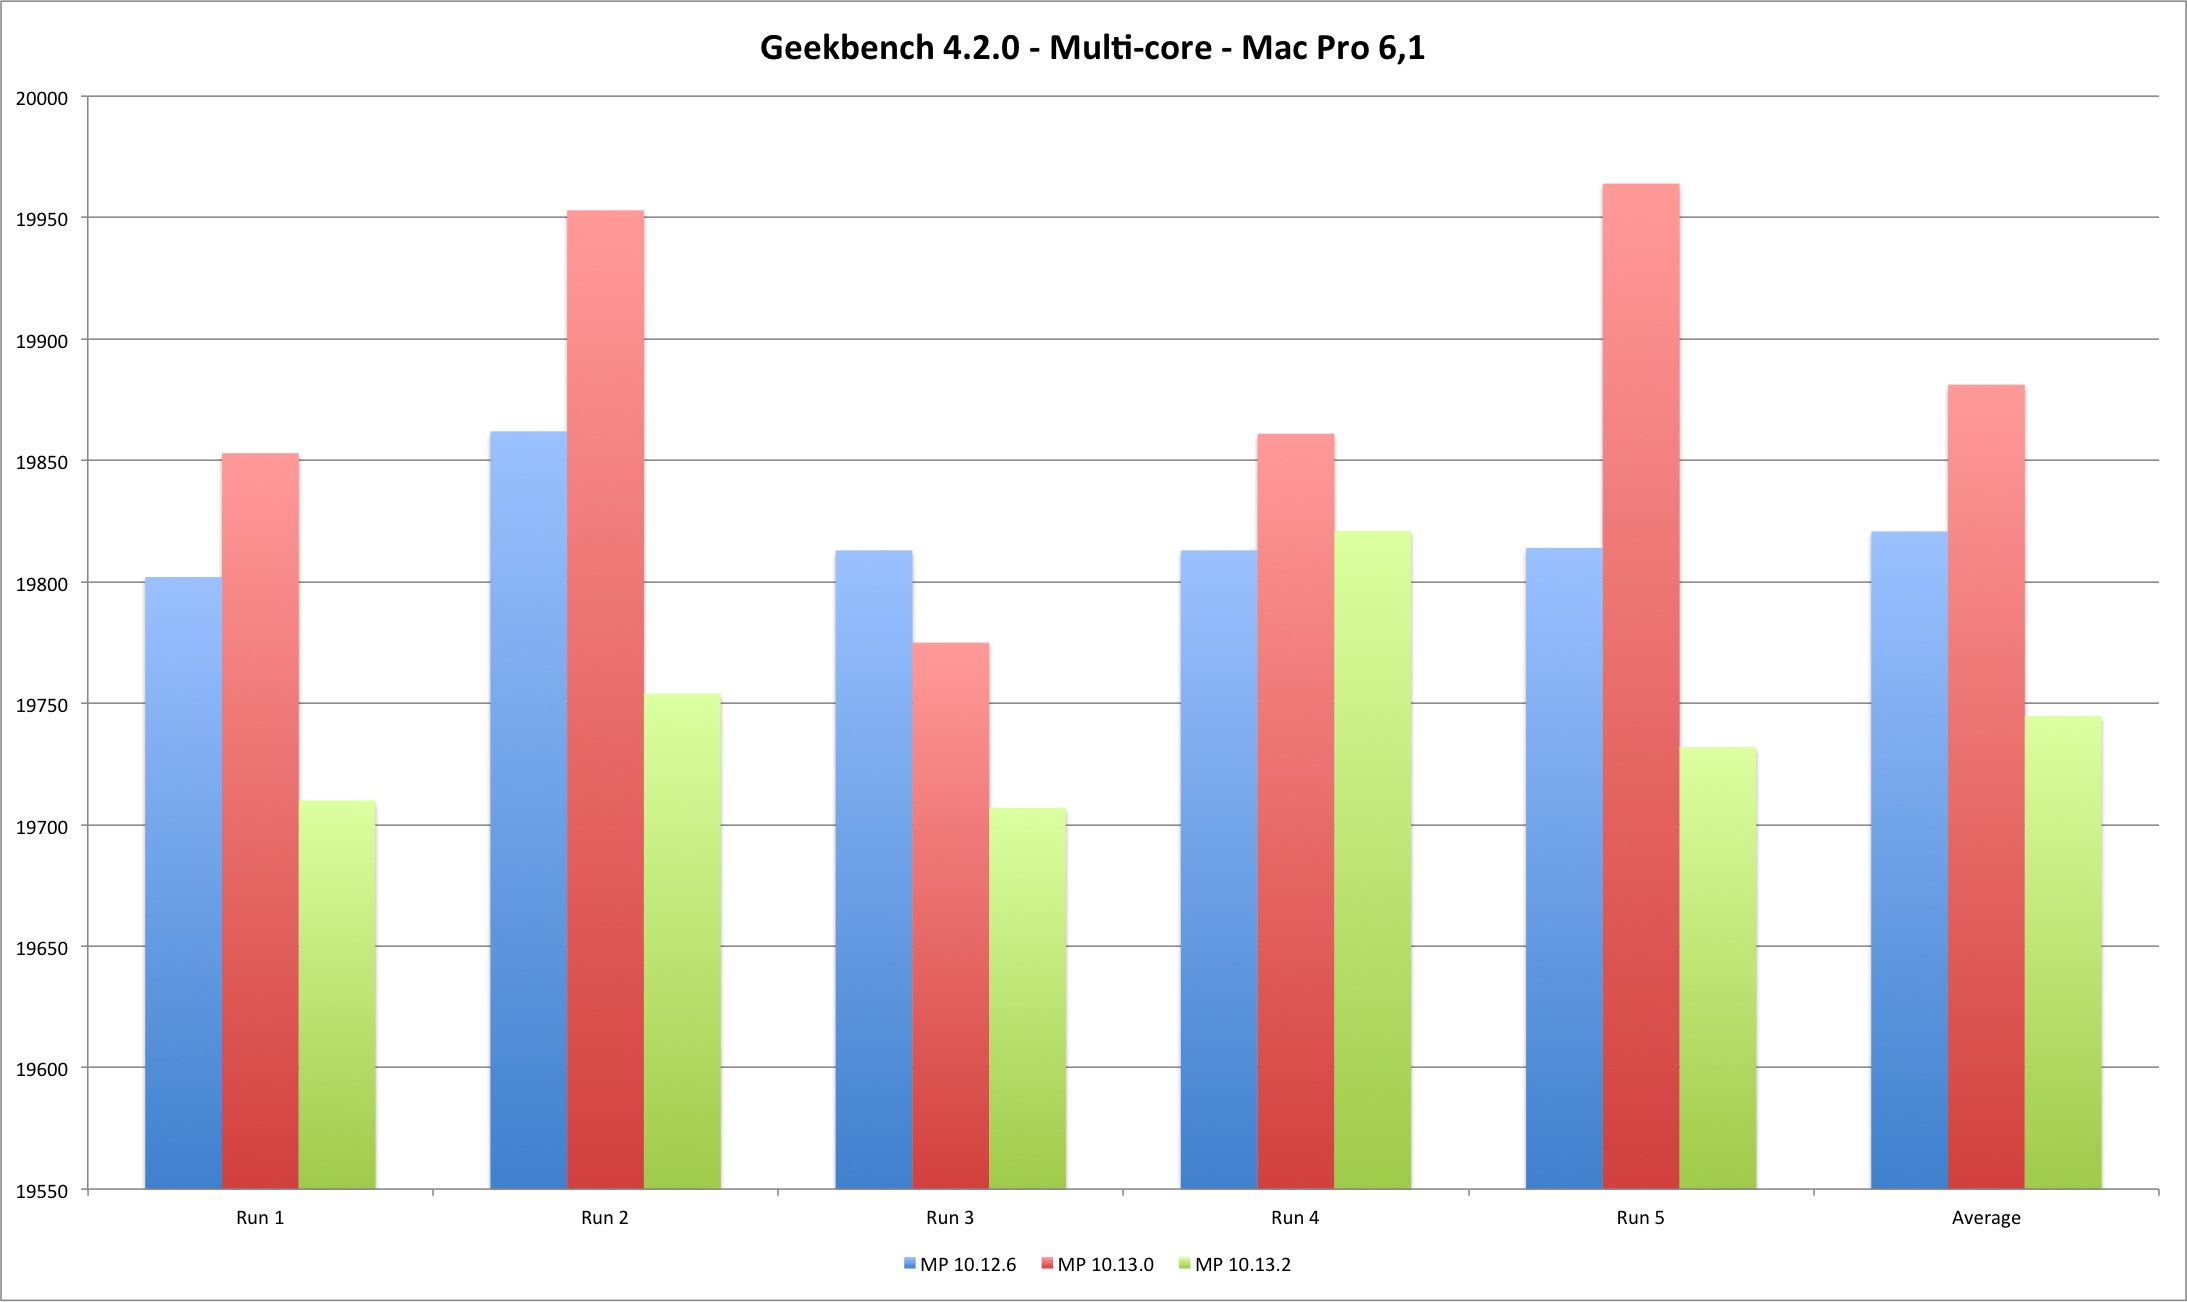
| Multi Core | MP 10.12.6 | MP 10.13.0 | MP 10.13.2 |
|---|---|---|---|
| Run 1 | 19802 | 19853 | 19710 |
| Run 2 | 19862 | 19953 | 19754 |
| Run 3 | 19813 | 19775 | 19707 |
| Run 4 | 19813 | 19861 | 19821 |
| Run 5 | 19814 | 19964 | 19732 |
| Average | 19820,8 | 19881,2 | 19744,8 |
The Geekbench results with my reduced machine sample set are in line with Apple’s bulletin - the performance reduction measured by Geekbench is mostly irrelevant (unless you are some Geekbench freak trying to rank the highest score possible).
Now let’s try to assess performance using some mundane daily tasks - compiling XNU kernel, unpacking an archive, and then move to a very specific task, massive syscall execution.
Compiling XNU 10.13.0
The first test is to compile the open source XNU kernel available at Apple open source site. The High Sierra version has some weird compilation dependencies so I have used Brandon Azad script available here. It automates the installation of everything necessary to build XNU. The test was essentially to compile and make clean, five times in a row.
The command line used to compile with the MacBook Pro was:time make -j4 SDKROOT=macosx ARCH_CONFIGS=X86_64 KERNEL_CONFIGS="RELEASE"
and for the Mac Pro:time make -j6 SDKROOT=macosx ARCH_CONFIGS=X86_64 KERNEL_CONFIGS="RELEASE"
This is the table with total seconds to finish compilation for each model.
| MBP 10.12.6 | MBP 10.13.0 | MBP 10.13.2 | MP 10.12.6 | MP 10.13.0 | MP 10.13.2 | |
|---|---|---|---|---|---|---|
| Run 1 | 270 | 280 | 304 | 175 | 164 | 177 |
| Run 2 | 274 | 280 | 286 | 166 | 164 | 168 |
| Run 3 | 270 | 279 | 287 | 166 | 164 | 169 |
| Run 4 | 270 | 280 | 287 | 166 | 165 | 168 |
| Run 5 | 269 | 280 | 287 | 165 | 164 | 168 |
| Average | 270,6 | 279,8 | 290,2 | 167,6 | 164,2 | 170 |
The results demonstrate a performance loss with 10.13.2 but also an interesting difference between the two machines. The MacBook build times always got worse with each new version, while in the Mac Pro High Sierra 10.13.0 improved the build times versus Sierra 10.12.6. Result of better multi-core performance observed in Geekbench results?
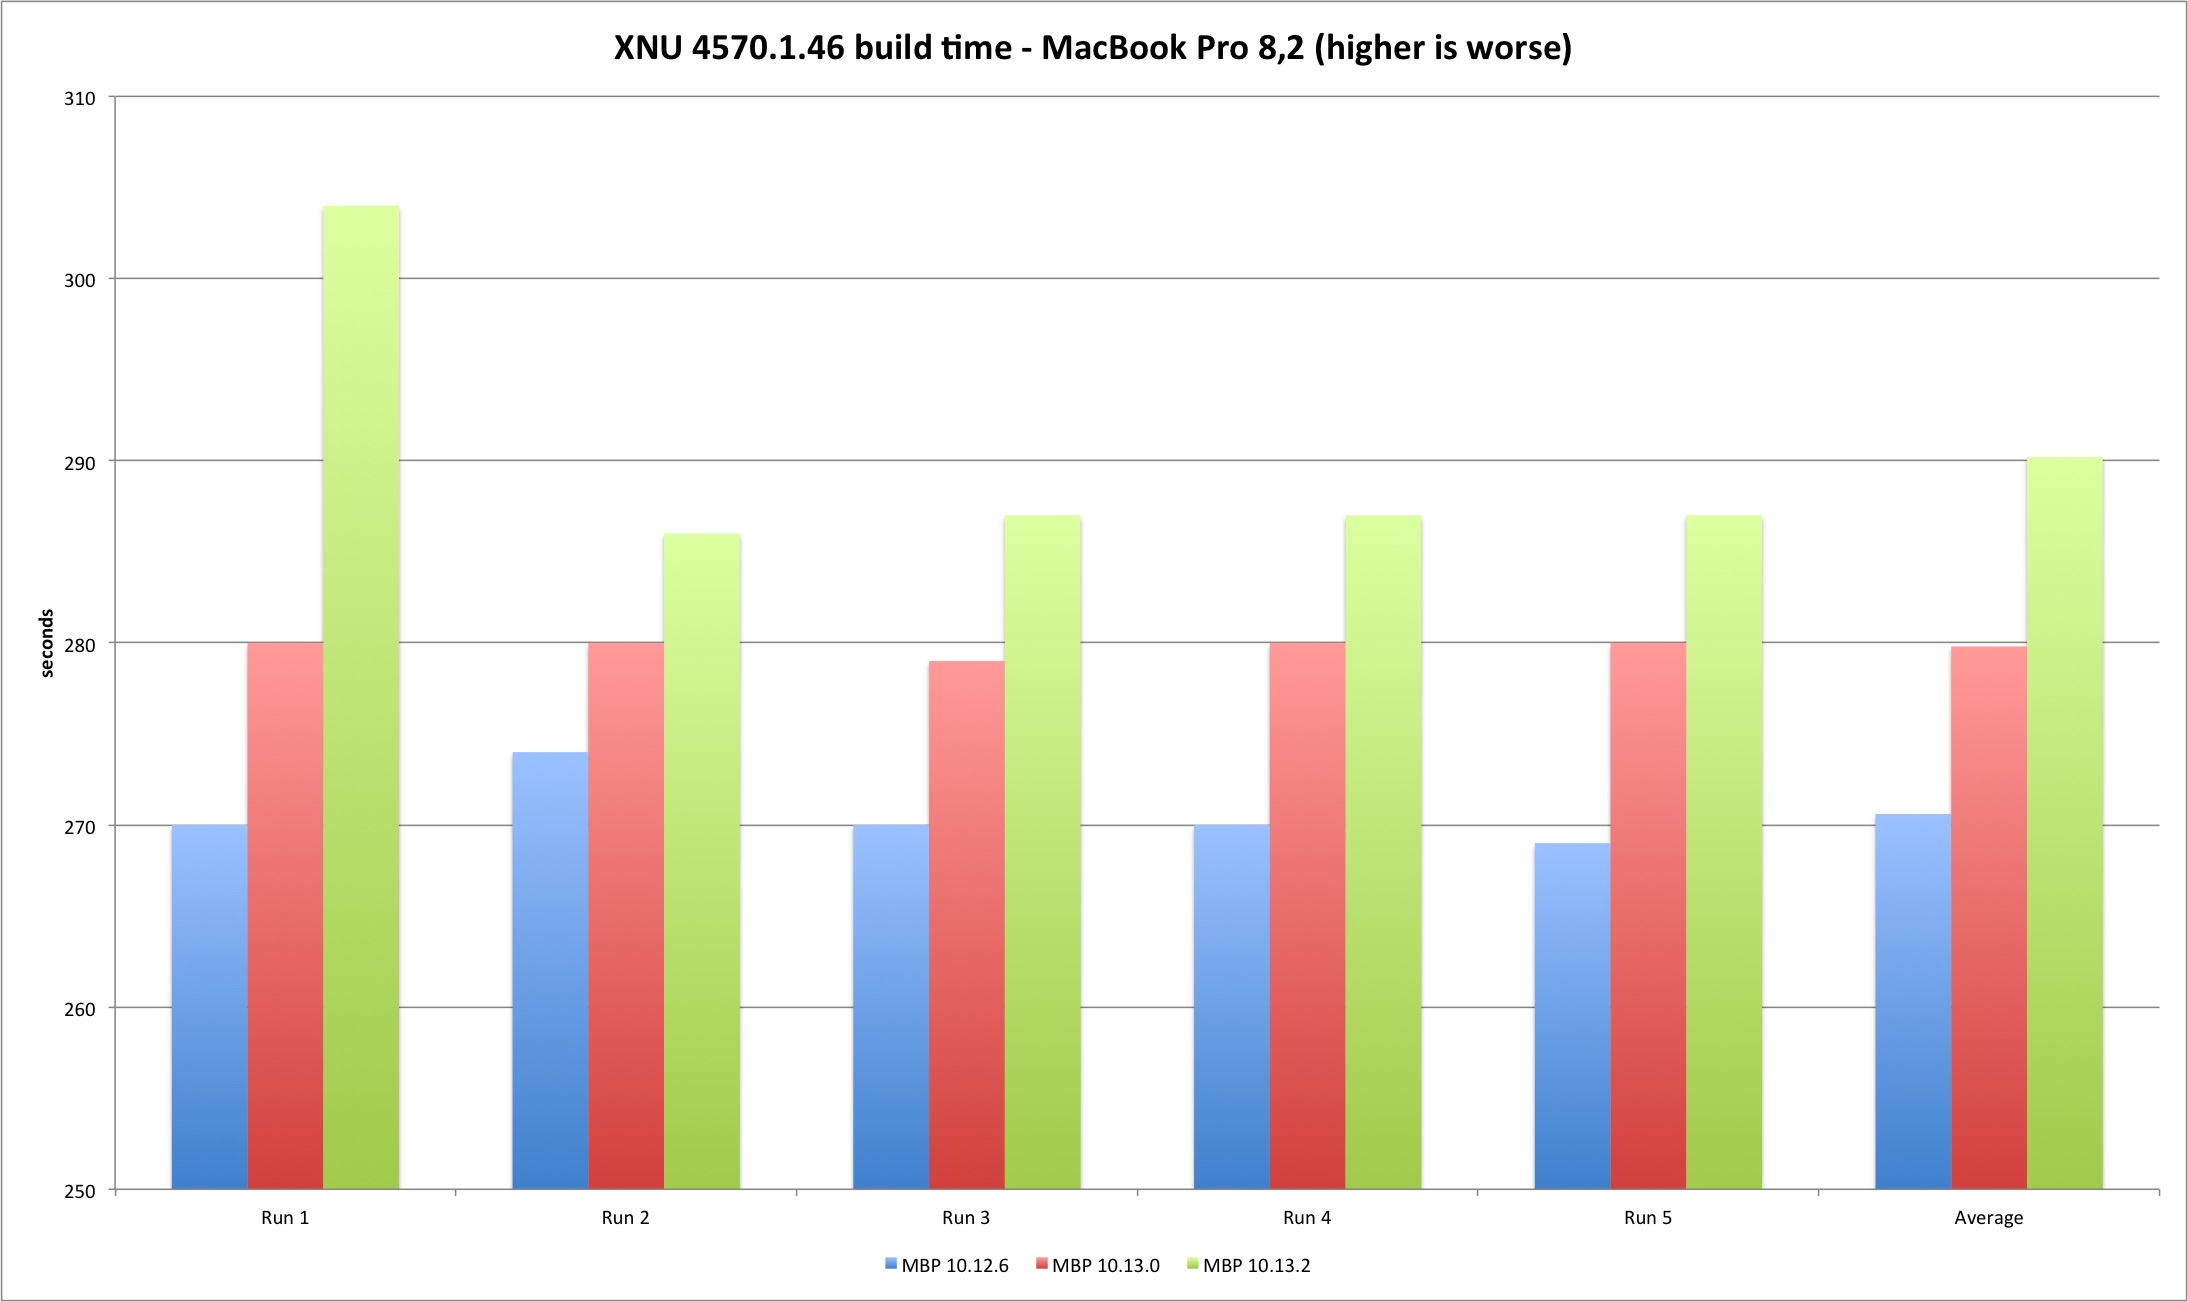
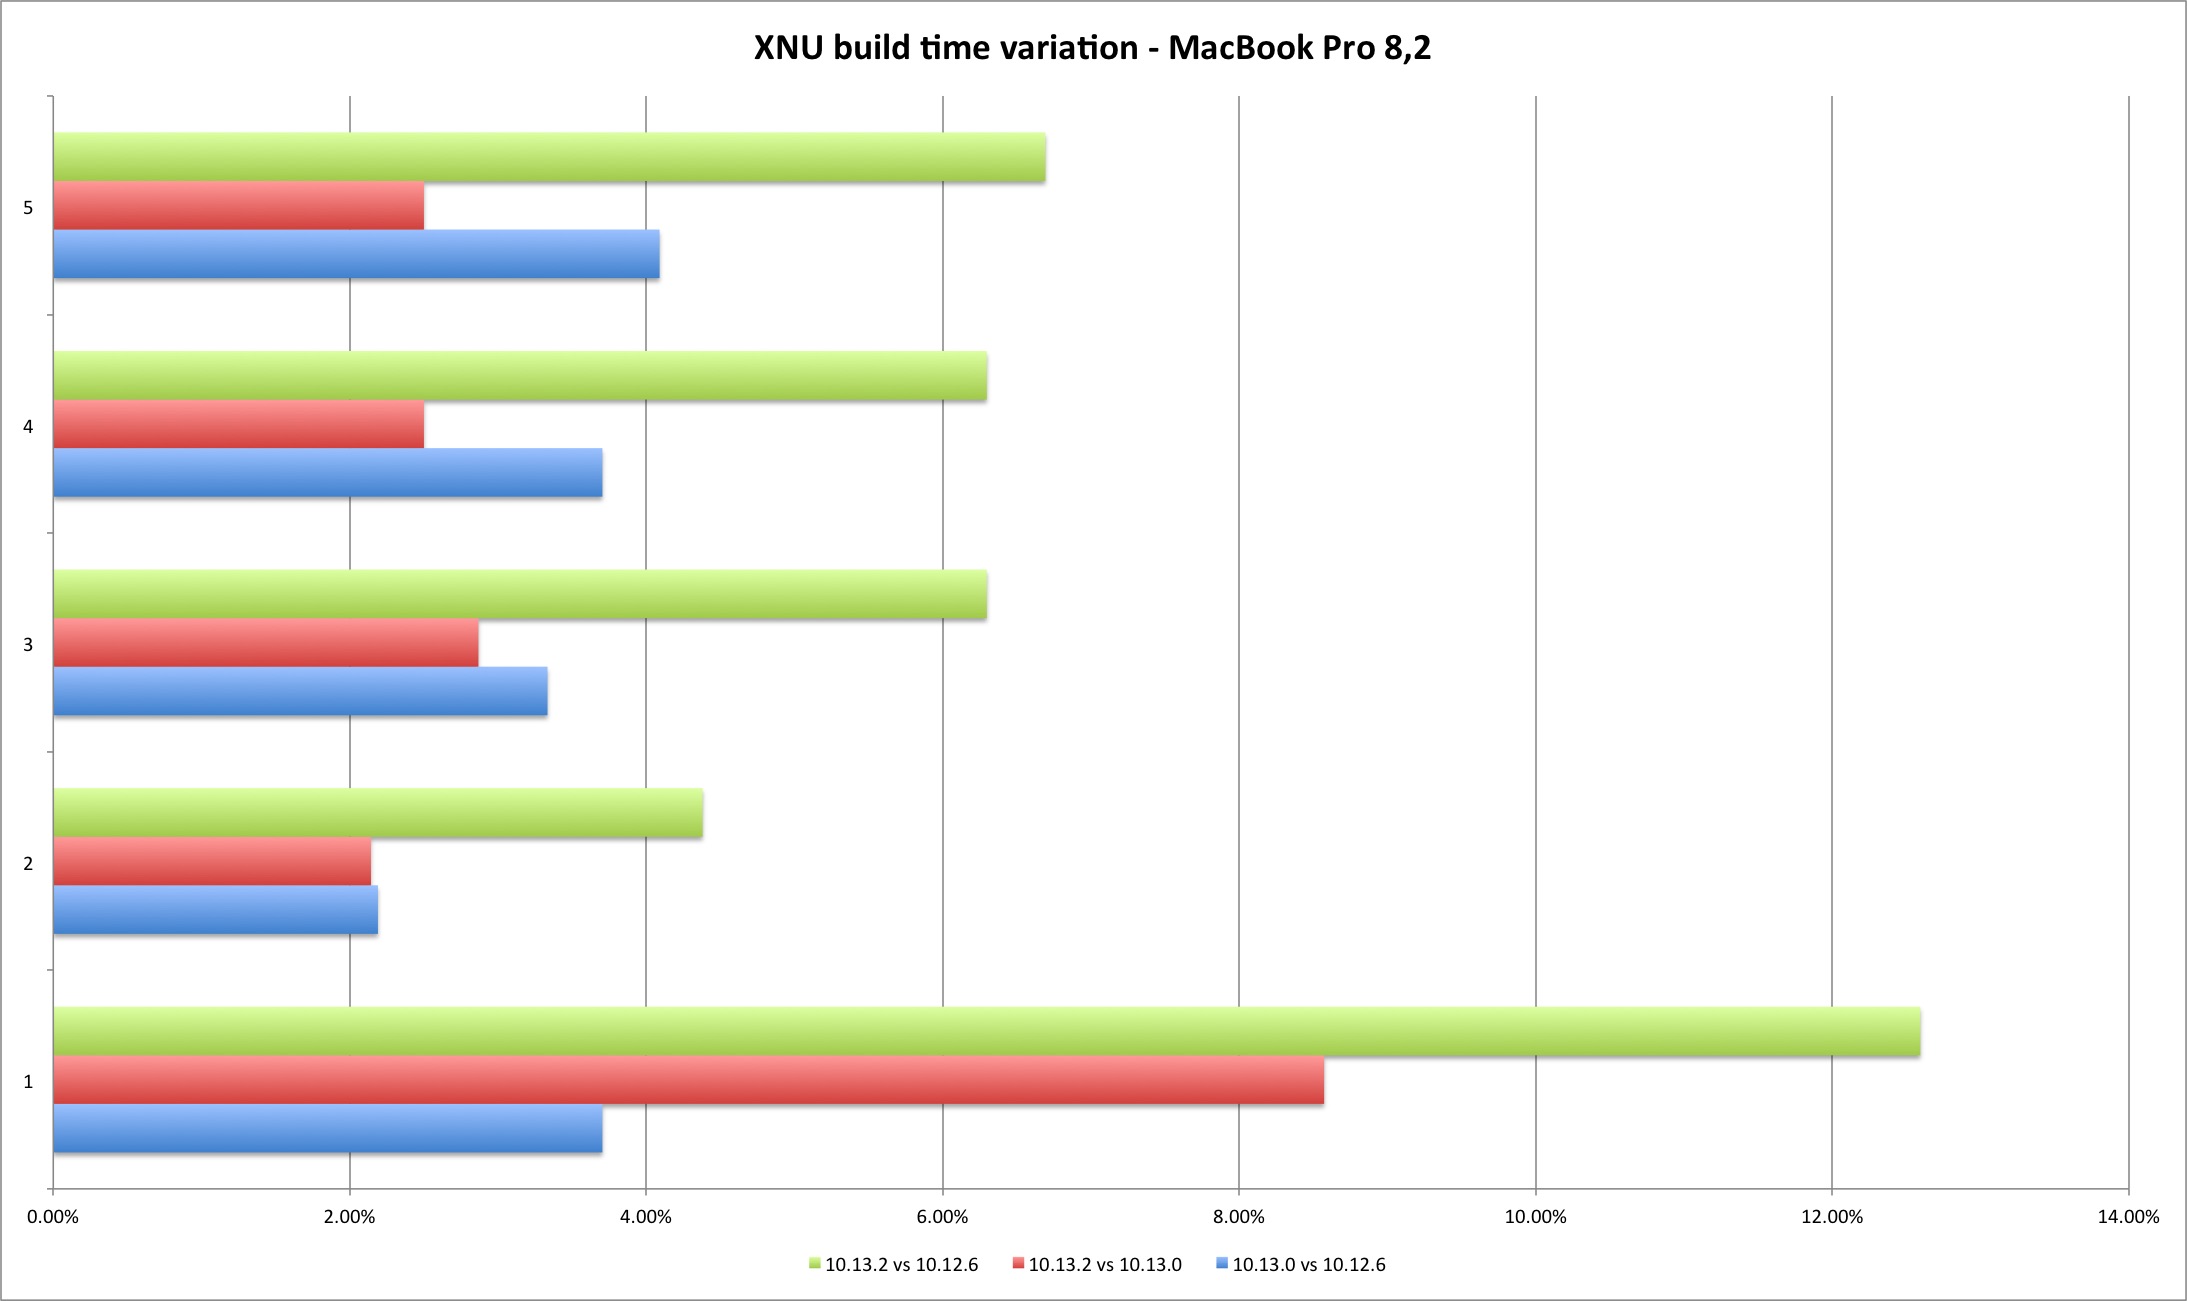
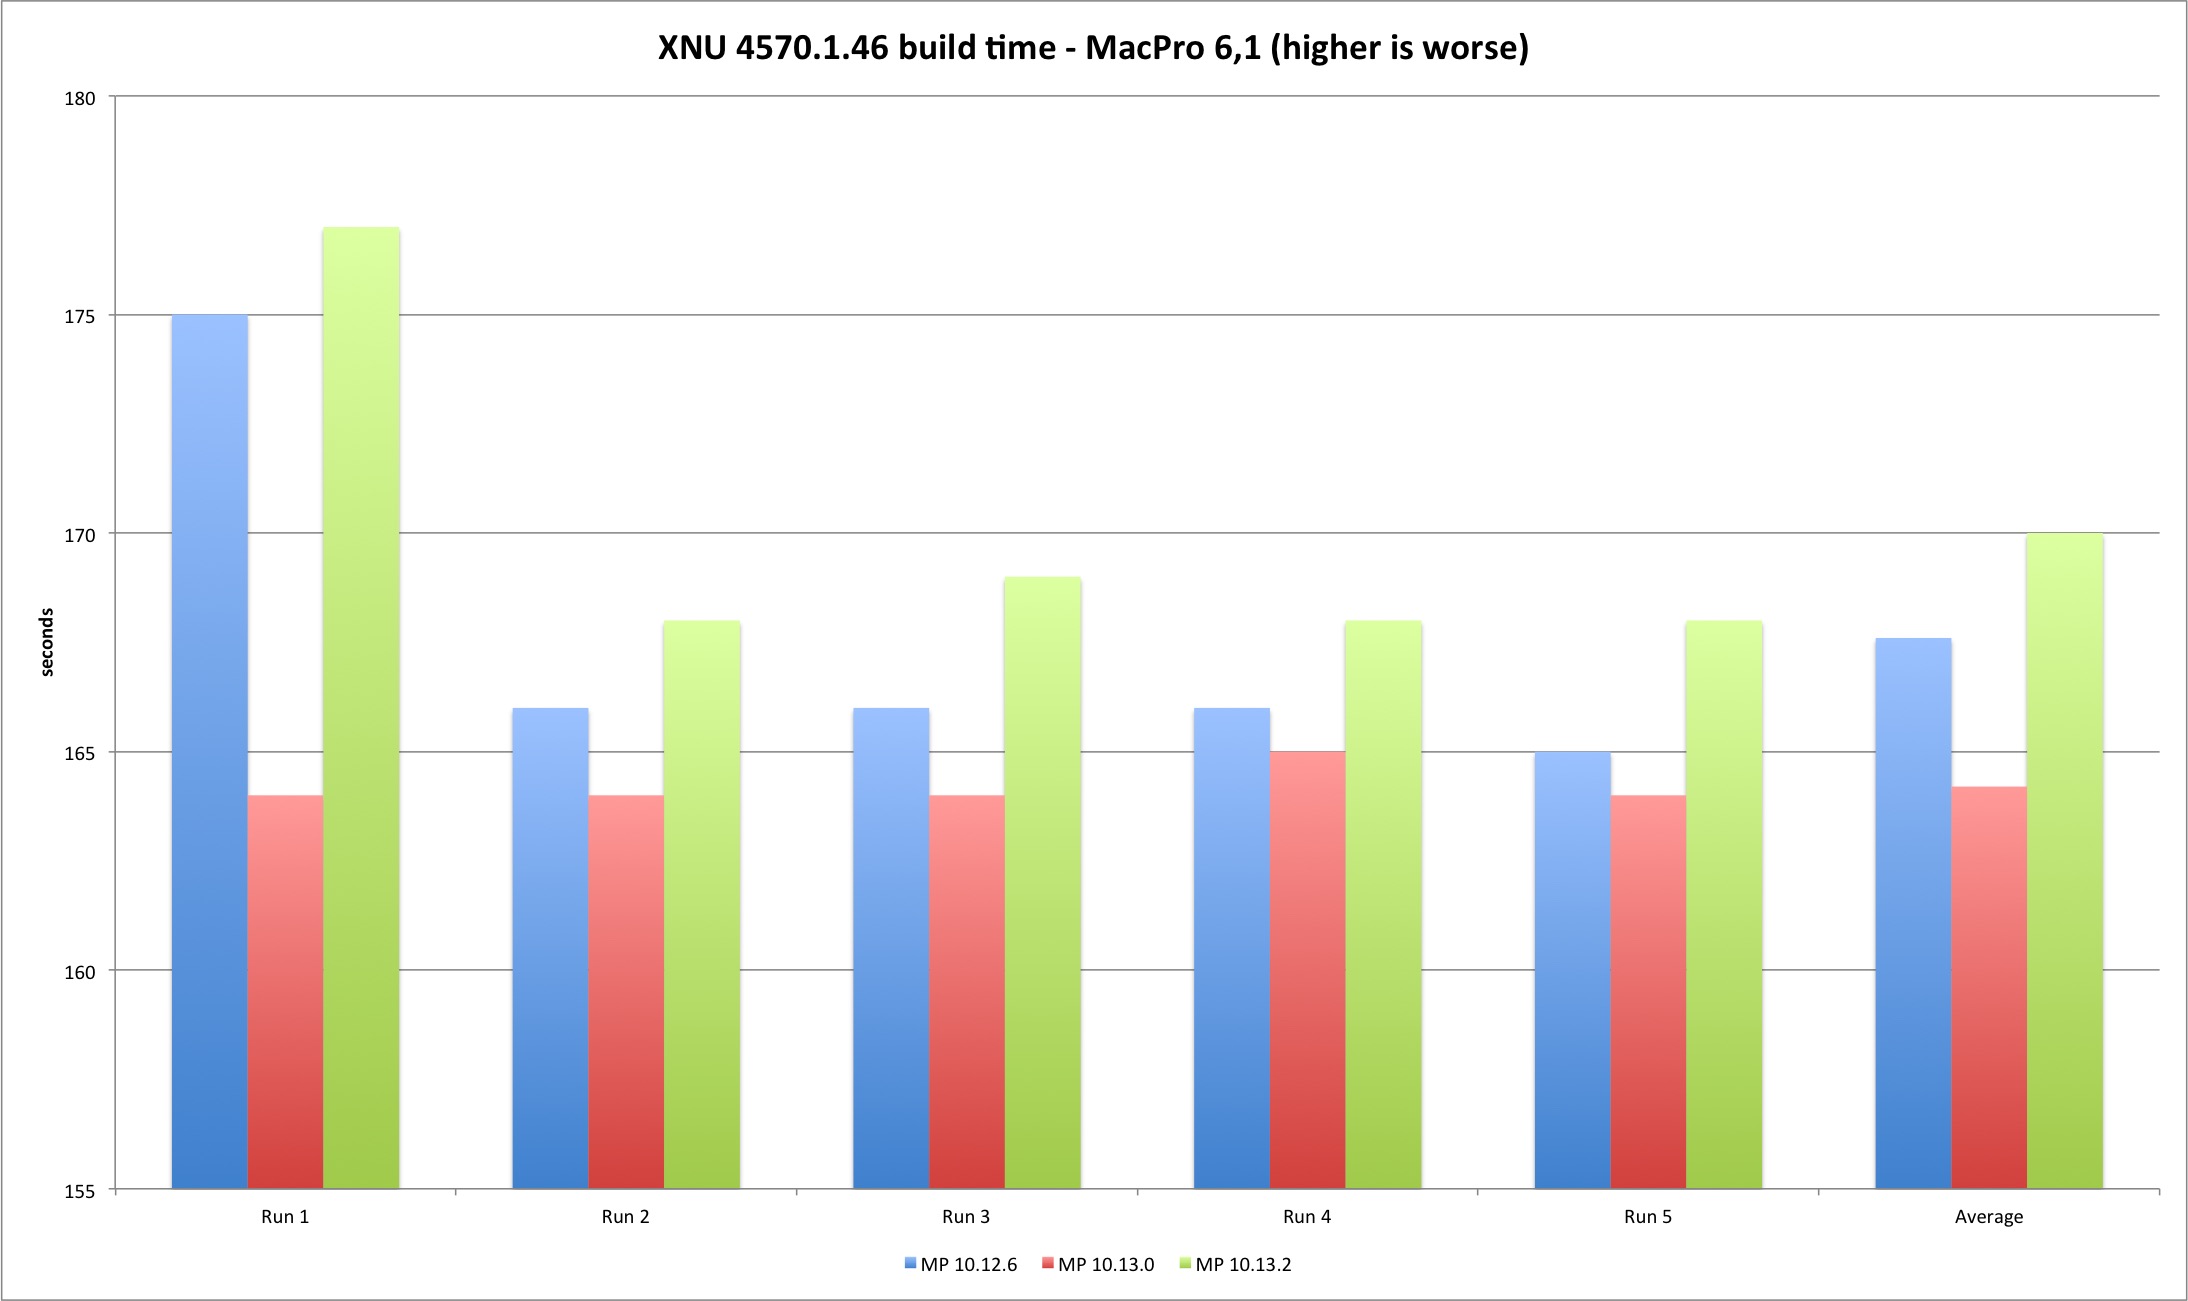
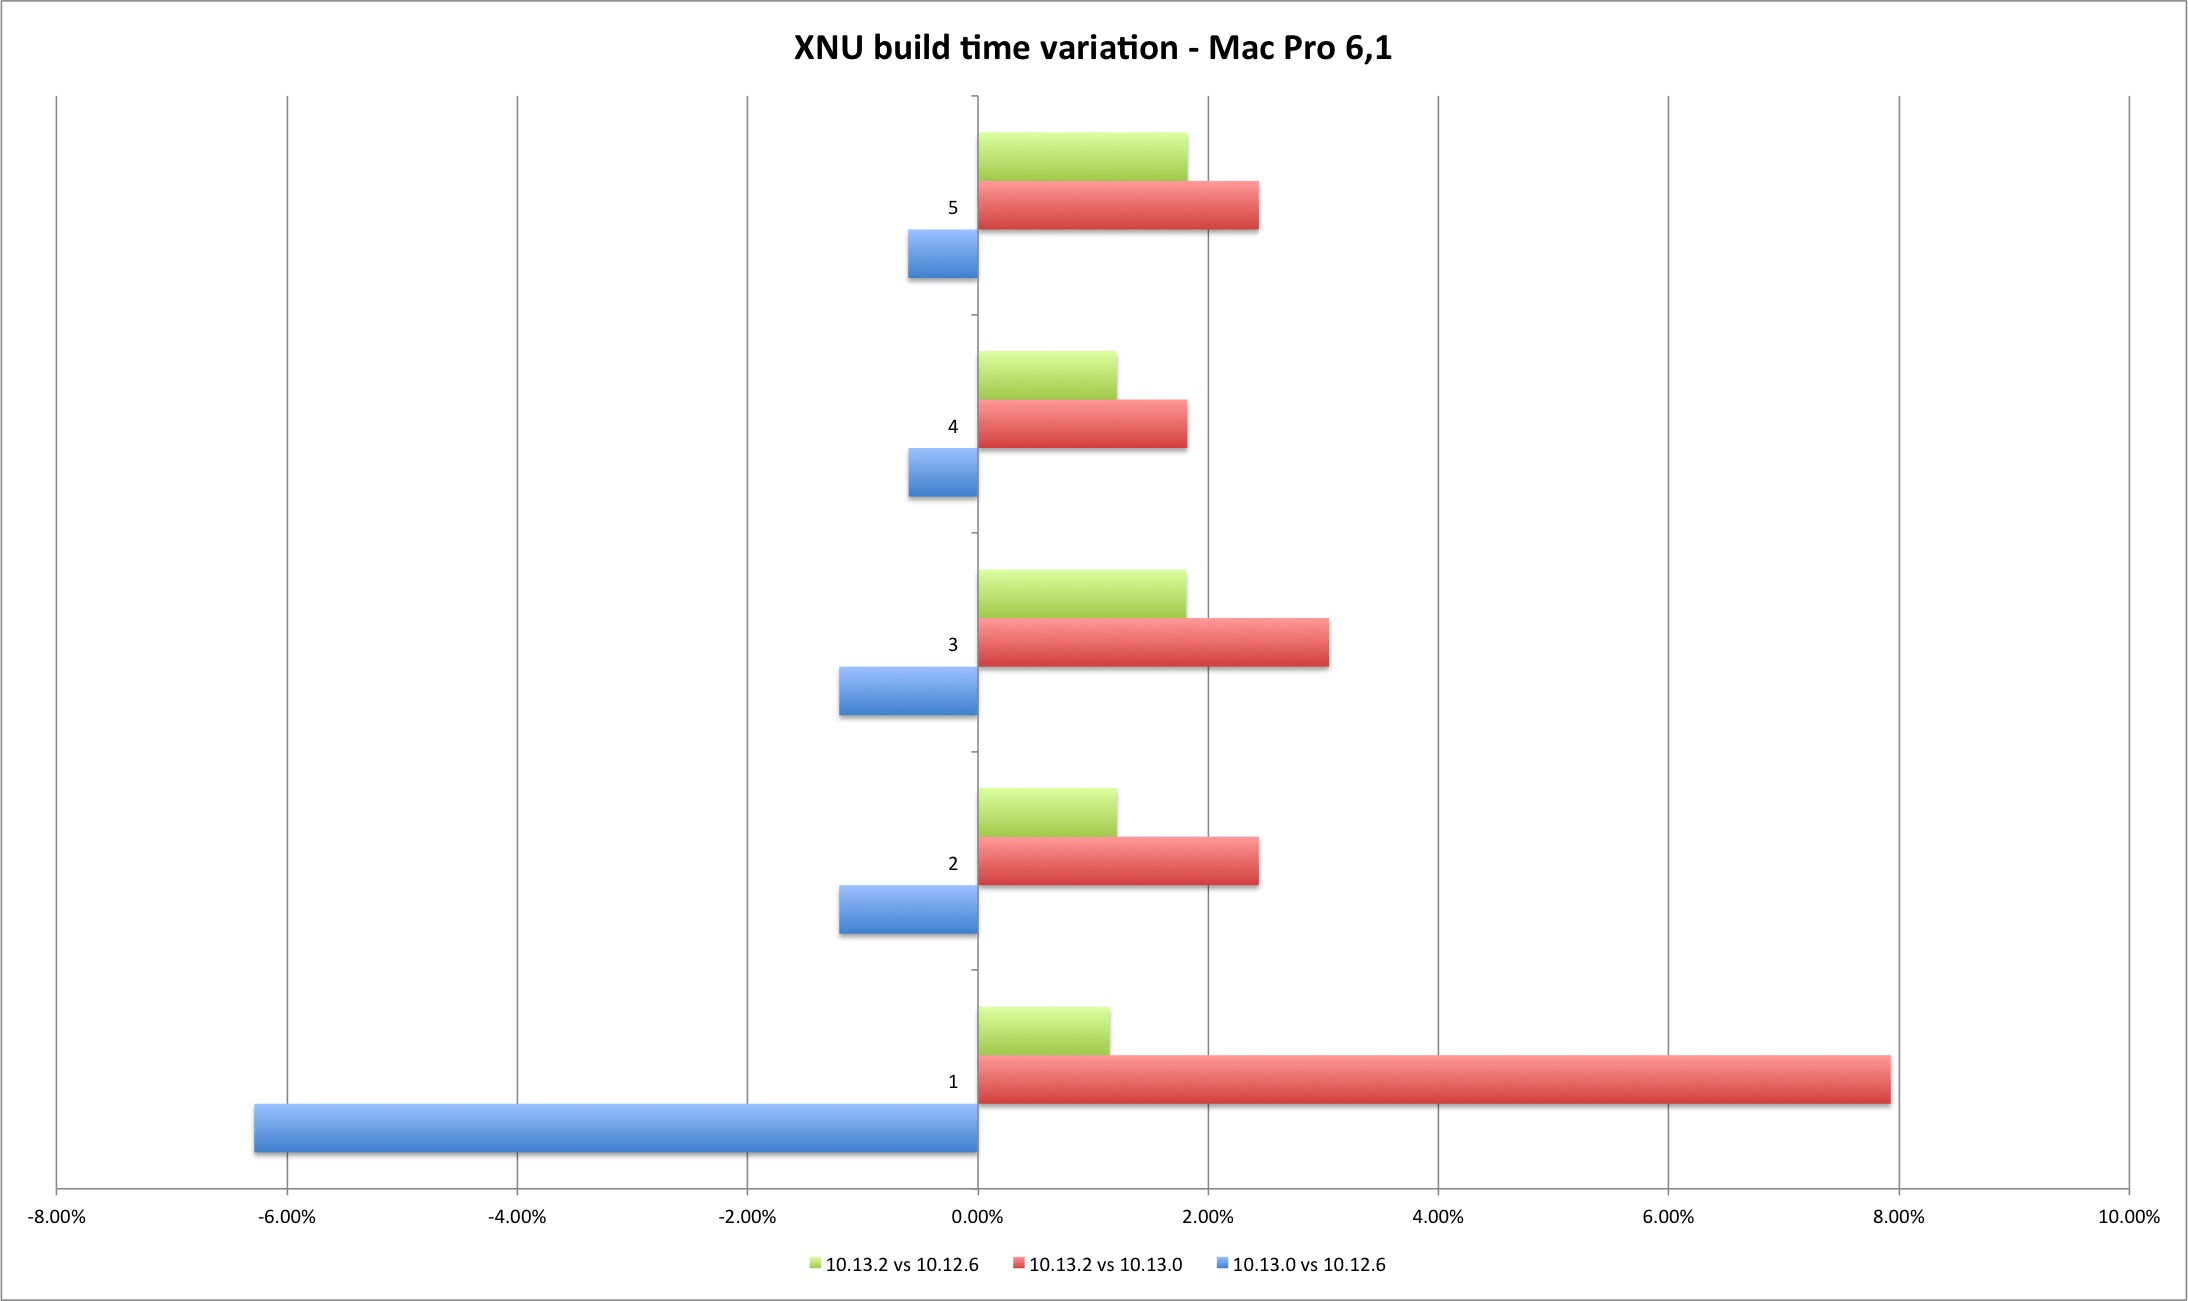
The performance loss compiling XNU exists but it’s still below two digits, 2% to 9%. It should be interesting (and important) to verify what is the result in larger projects, if it’s linear or goes exponentially worse (my expectation is that bigger projects with many source files might suffer because of syscall performance). What you should expect is slightly longer build times if you upgrade your build system to 10.13.2.
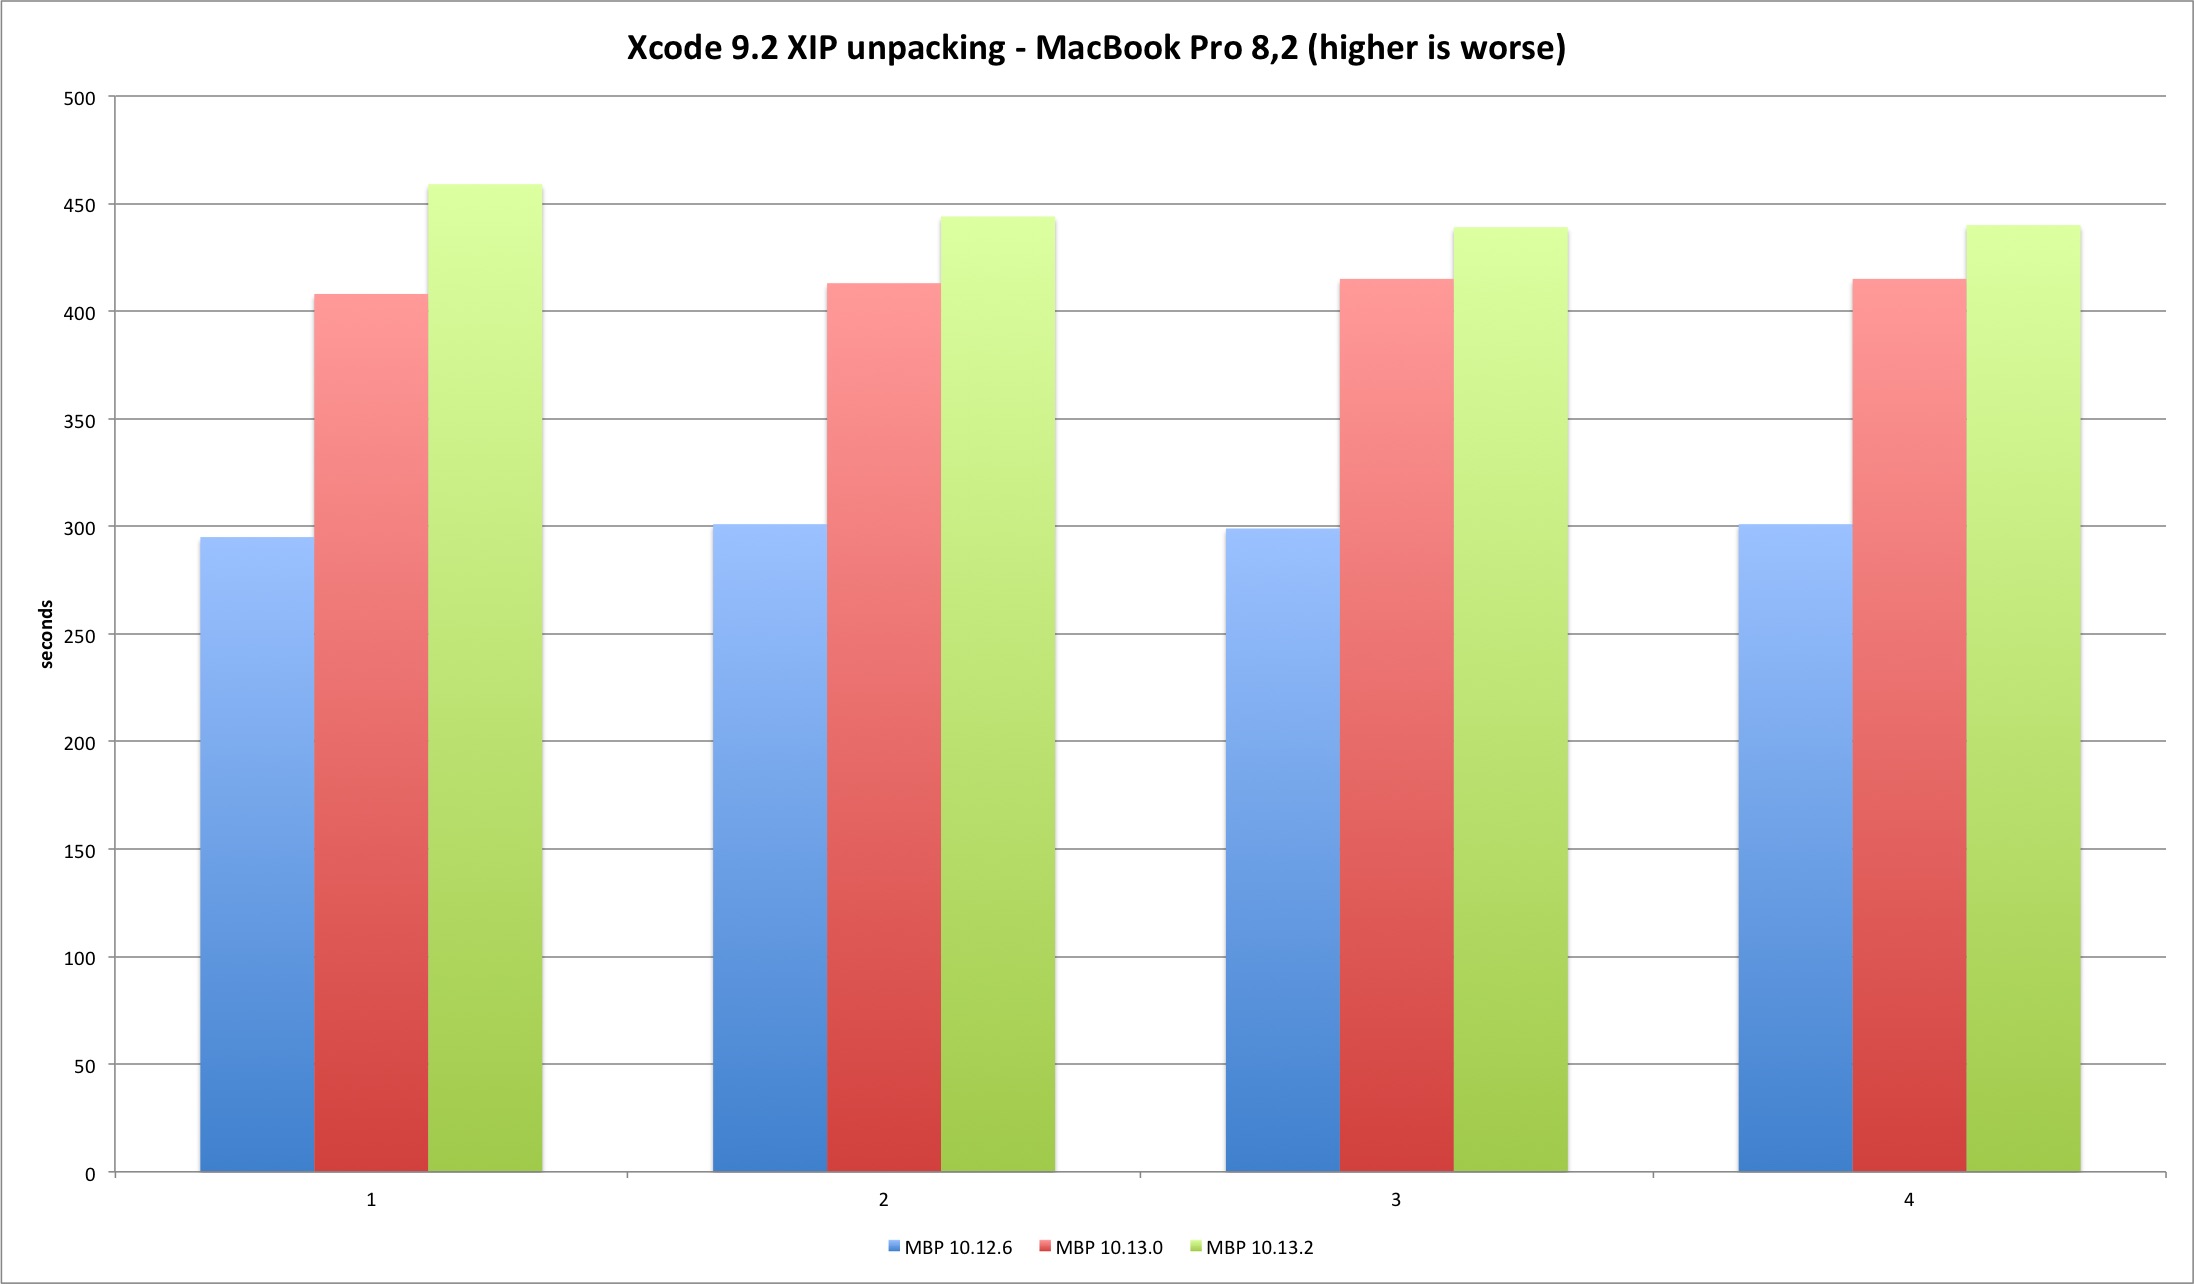
Xcode 9.2 unpacking
The next test is to expand Xcode 9.2 installation archive. This is a 5.2 GB archive that takes a while to extract and consumes enough CPU resources to start spinning MacBook’s fans. Sounds like a good test to measure CPU and disk performance. The results are somewhat interesting!
The 10.12.6 tests run against HFS+ filesystem, encrypted in the Mac Pro case, while High Sierra all run in unencrypted APFS.
| Xcode 9.2 XIP | MBP 10.12.6 | MBP 10.13.0 | MBP 10.13.2 | MP 10.12.6 | MP 10.13.0 | MP 10.13.2 |
|---|---|---|---|---|---|---|
| Run 1 | 295 | 408 | 459 | 180 | 253 | 275 |
| Run 2 | 301 | 413 | 444 | 181 | 254 | 277 |
| Run 3 | 299 | 415 | 439 | 182 | 255 | 276 |
| Run 4 | 301 | 415 | 440 | N/A | 254 | 274 |
The Mac Pro is around 60% faster than the MacBook Pro, but the performance loss will be similar in both.
| MBP vs MP | 10.12.6 | 10.13.0 | 10.13.2 |
|---|---|---|---|
| Run 1 | 61,02% | 62,01% | 59,91% |
| Run 2 | 60,13% | 61,50% | 62,39% |
| Run 3 | 60,87% | 61,45% | 62,87% |
| Variation | 10.13.0 vs 10.12.6 | 10.13.2 vs 10.13.0 | 10.13.2 vs 10.12.6 |
|---|---|---|---|
| Run 1 | 38,31% | 12,50% | 55,59% |
| Run 2 | 37,21% | 7,51% | 47,51% |
| Run 3 | 38,80% | 5,78% | 46,82% |
| Run 4 | 37,87% | 6,02% | 46,18% |
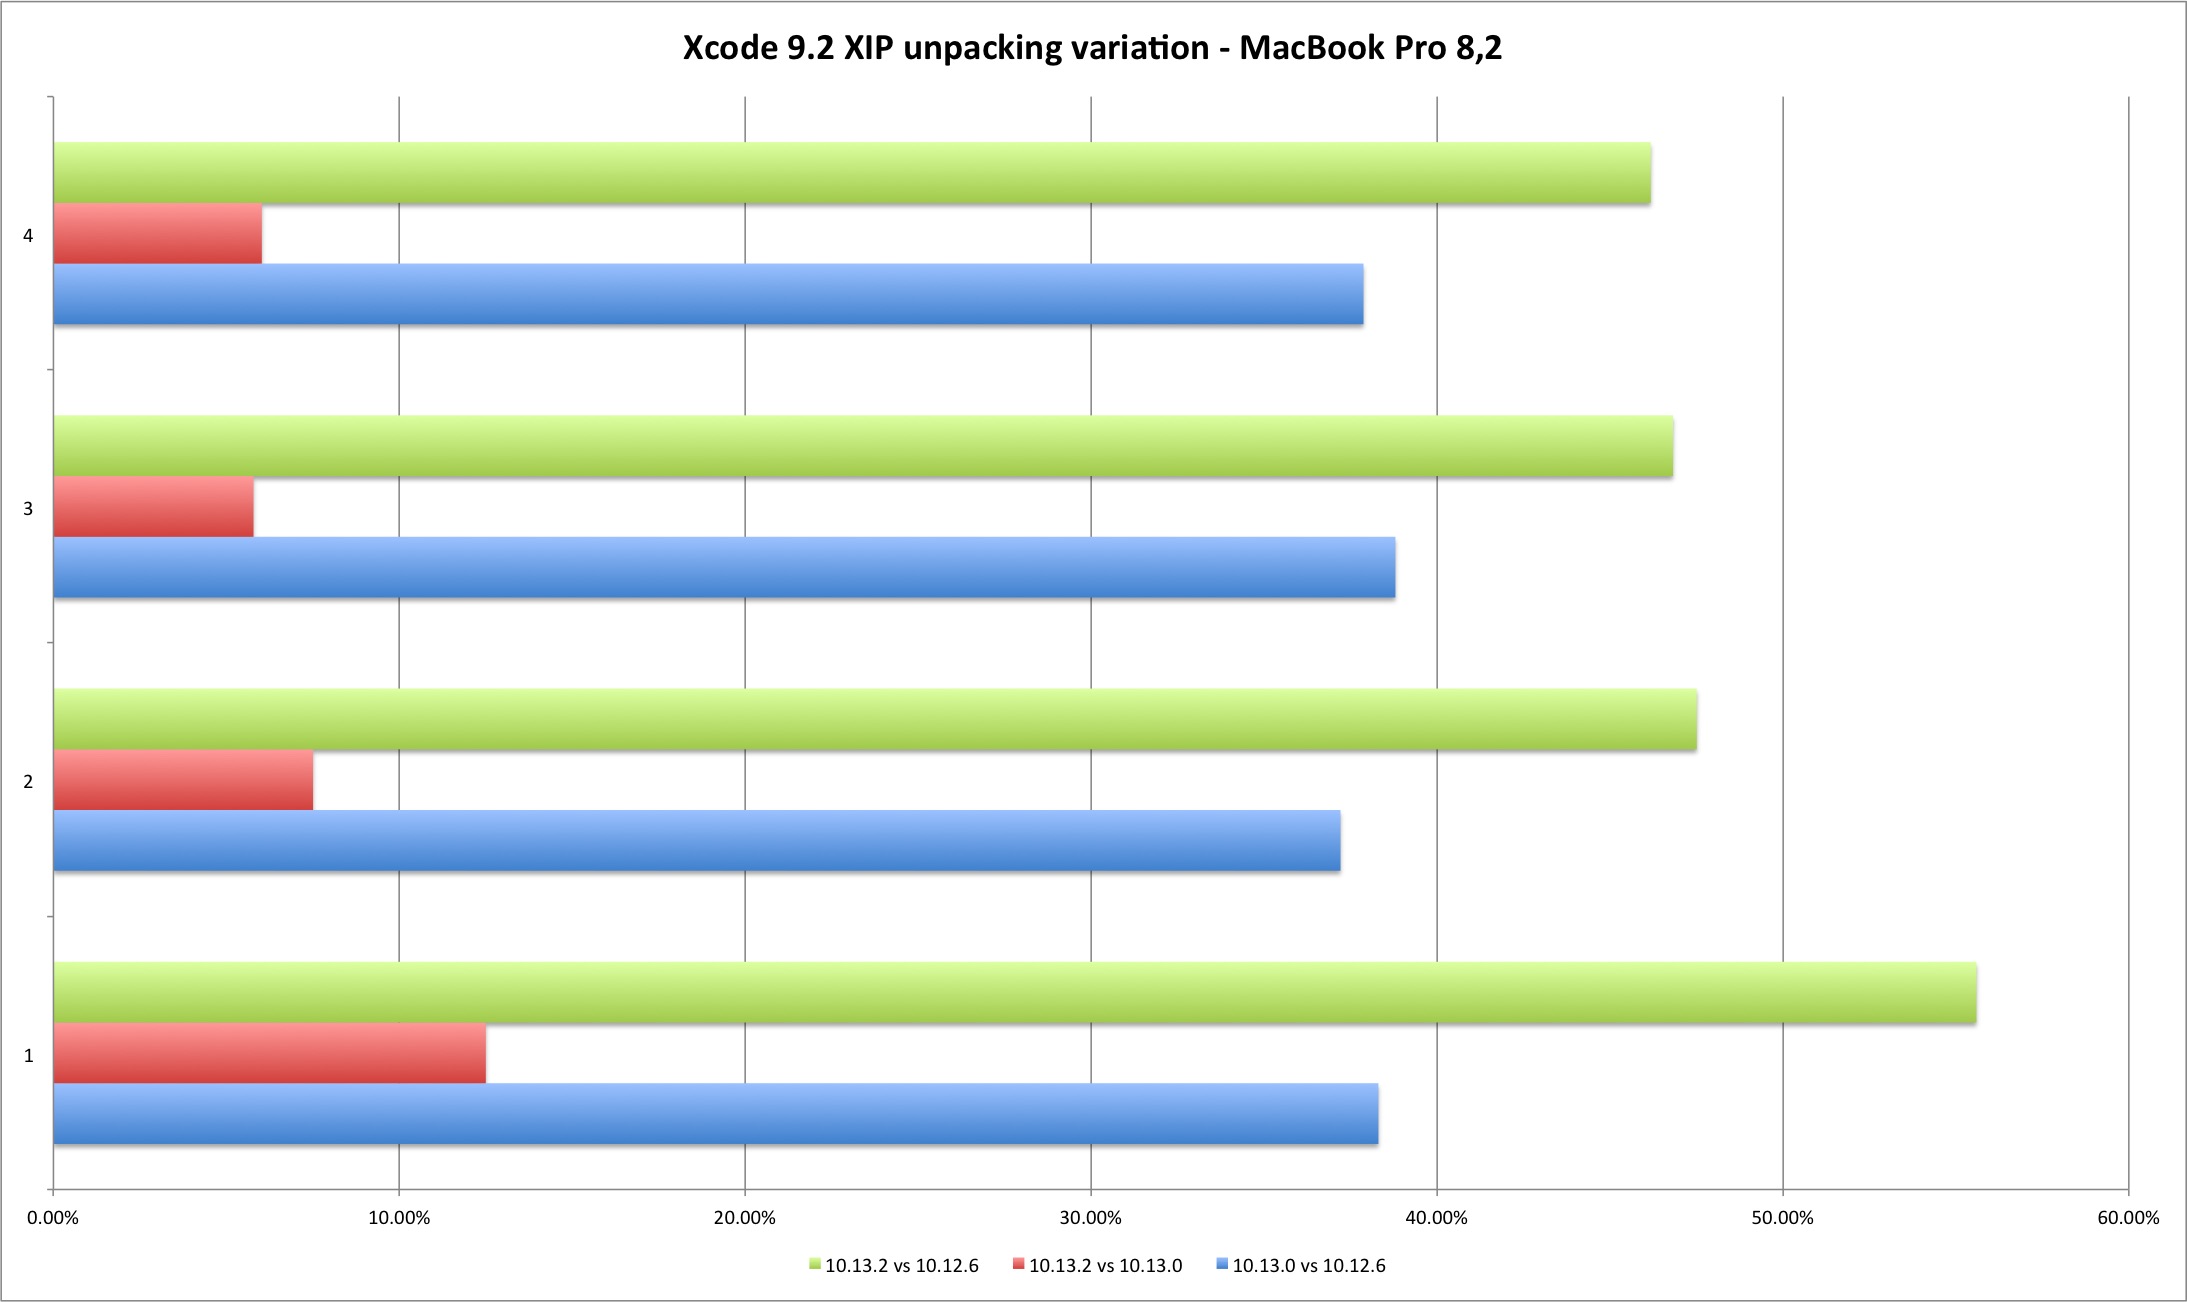
We can observe that the performance loss between Sierra to High Sierra (HFS+ to APFS) is considerable and around 40% or more. It’s also clear the degradation from 10.13.0 to 10.13.2 - the fix appears to introduce an additional performance cost.
Now the results for the Mac Pro.
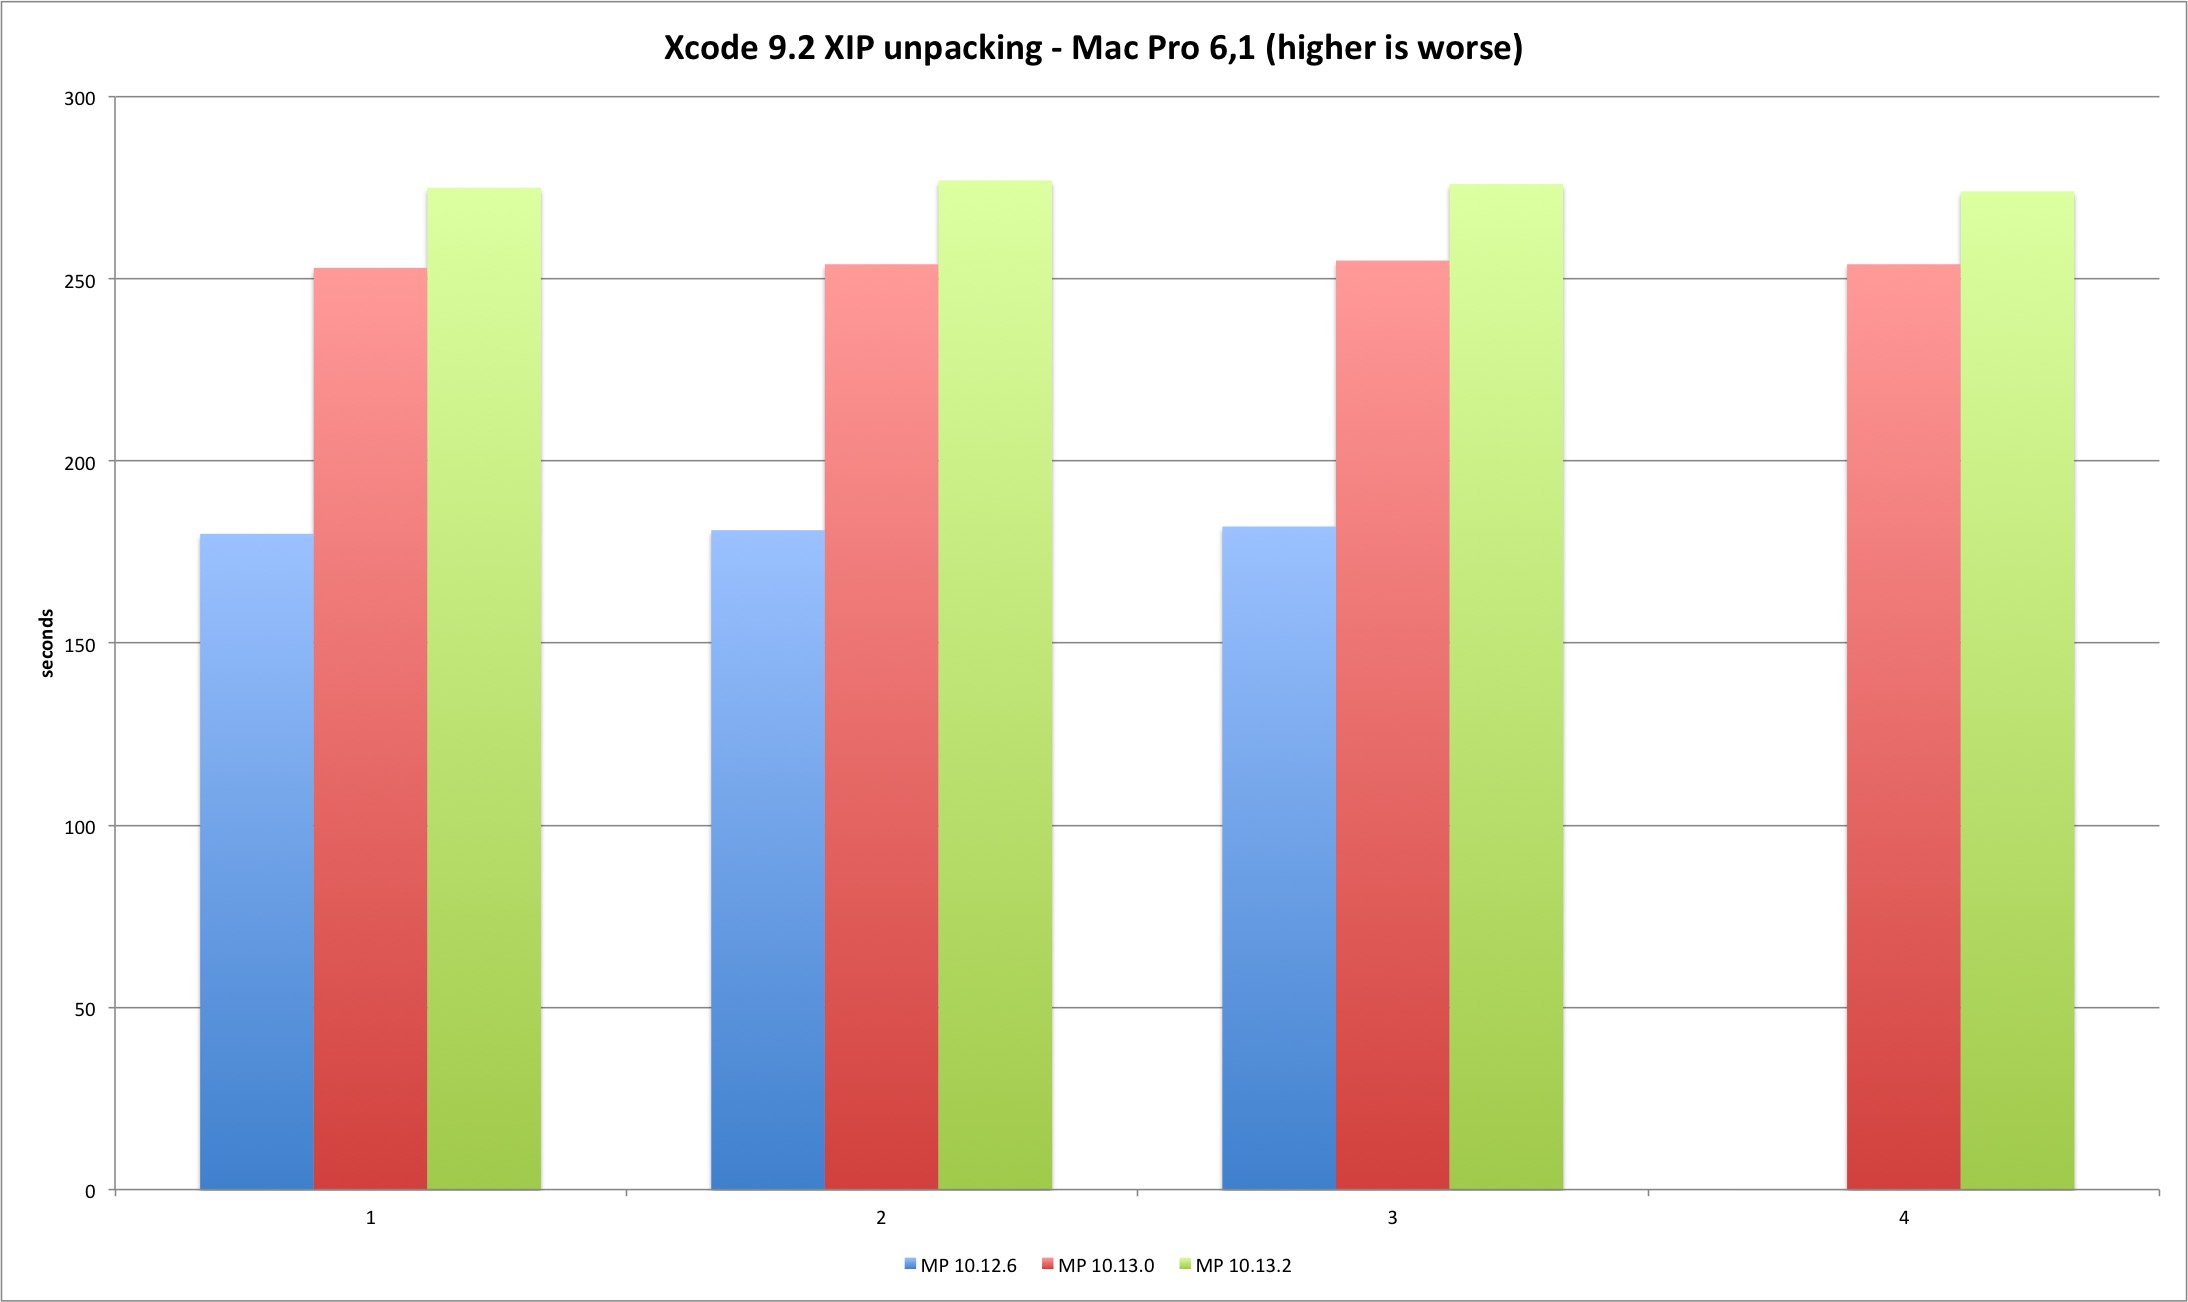
| Variation | 10.13.0 vs 10.12.6 | 10.13.2 vs 10.13.0 | 10.13.2 vs 10.12.6 |
|---|---|---|---|
| Run 1 | 40,56% | 8,70% | 52,78% |
| Run 2 | 40,33% | 9,06% | 53,04% |
| Run 3 | 40,11% | 8,24% | 51,65% |
| Run 4 | N/A | 7,87% | N/A |

The Xcode test shows that the performance loss exists with 10.13.2. But in what was a shock to me, APFS appears to introduce a considerable performance loss, even against an HFS+ encrypted filesystem. I heard before some buzz about APFS performance issues but this was the first time I installed High Sierra outside a virtual machine and measured its performance. The Meltdown patch introduces less than two digits performance loss in this test but APFS apparently generates a considerable filesystem performance loss. I wonder how much of this is perceived by the user in daily tasks. Something to measure with additional filesystem tests.
The last tests and the ones with really shocking results try to measure syscall performance. The reason for this is that syscalls make the transition from user to kernel and are directly affected by this particular patch design. These are extreme tests and where some Internet drama will focus. But the results can’t be taken at “face” value - they are somewhat atrocious but their impact will be different depending on workloads and type of work. No normal application is trying to execute 250 million syscalls as fast as possible. There are applications that depend more on syscalls than others and those will definitely suffer.
So the main reason for these extreme tests is to show that the impact is real and that you should try to measure your specific use cases. The workaround design concepts are shared between different operating systems so results similar to these are expected - their values should be different but not far away (that is my expectation).
Where possible I executed three versions per test.
- A 64 bits binary using syscall interface directly from assembler.
- A 64 bits binary using system libraries.
- A 32 bits binary using system libraries.
The assembly version is expected to always be the fastest one due to system libraries overhead except cases where caching exists. I will explain these later on.
The syscalls used are getpid, read, write, lseek, gettimeofday.
Once again you can find the code here.
empty function call
The first test is sort of a placebo and it doesn’t involve syscalls. It’s just a call to an empty function.
#include <unistd.h>

__attribute__ ((optnone)) int foo(void)
{
	return 0;
}

__attribute__ ((optnone))
int main(void)
{
	for(ssize_t i = TOTAL_EXECS; i > 0; i--)
	{
		foo();
	}
	return 0;
}
The attribute is required because in O2 mode the compiler will optimize and remove the useless function call.
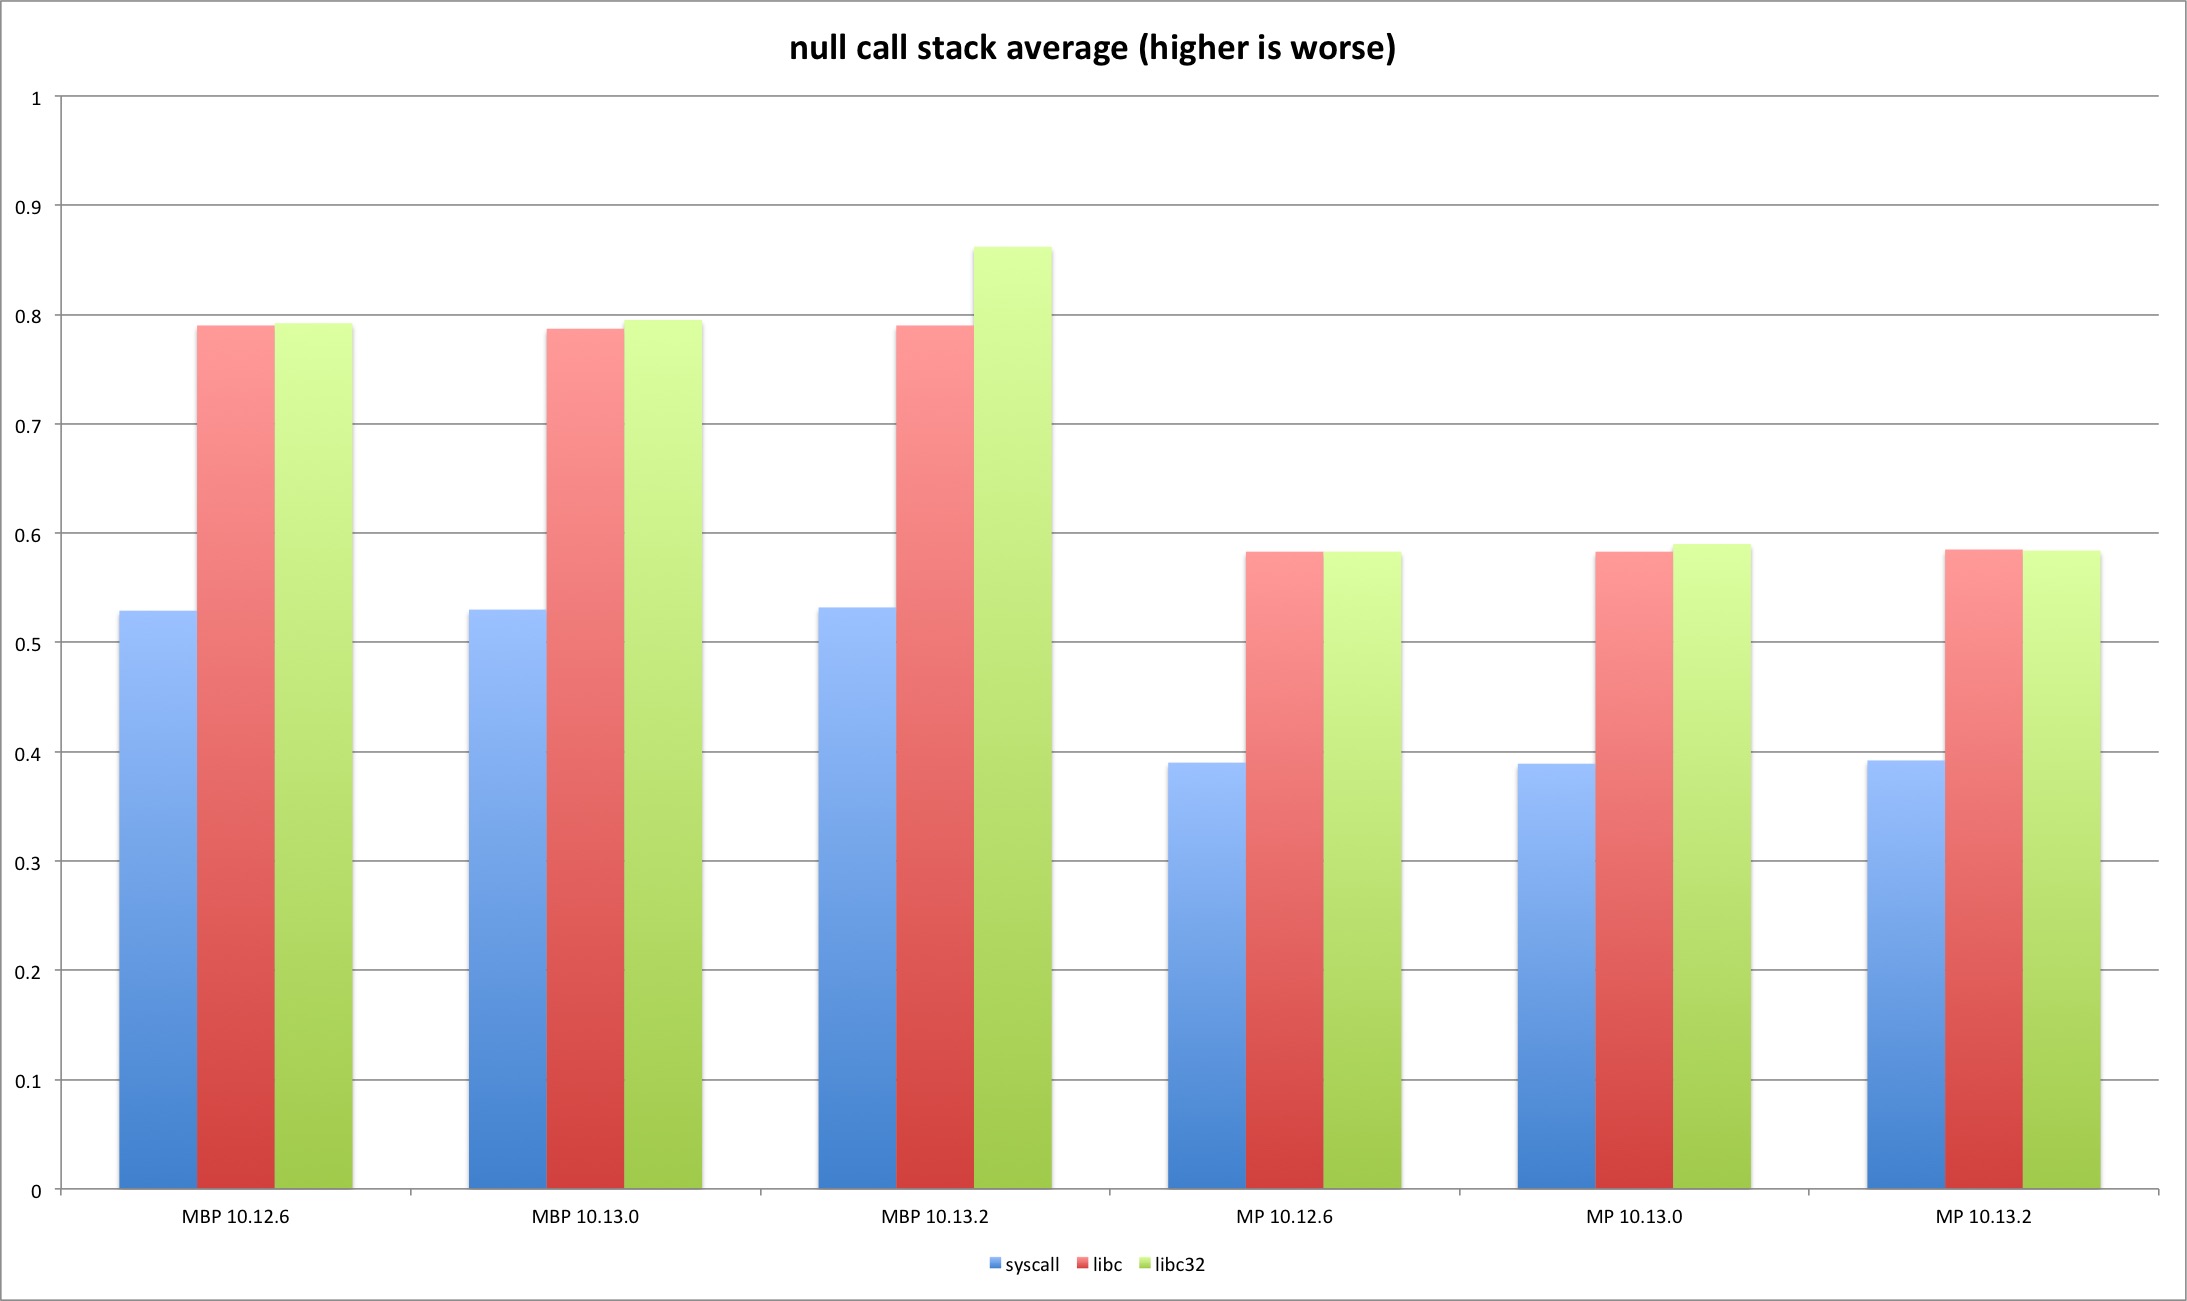
Because the results are very similar and it’s just a placebo test the graph only shows the average for each test. We can observe that there are no significant differences between the OS X versions. This was the expected result due to no syscall involvement (except on exit). The tests using system libraries (libc and libc32) have slightly higher overhead because the produced code contains more instructions versus the assembly version.
getpid
The first tested syscall is getpid(). Its kernel implementation is very simple:
int
getpid(proc_t p, __unused struct getpid_args *uap, int32_t *retval)
{
	*retval = p->p_pid;
	return (0);
}
Execution should be pretty fast, most of the overhead will be spent in the transition between user and kernel, and not in the function itself.
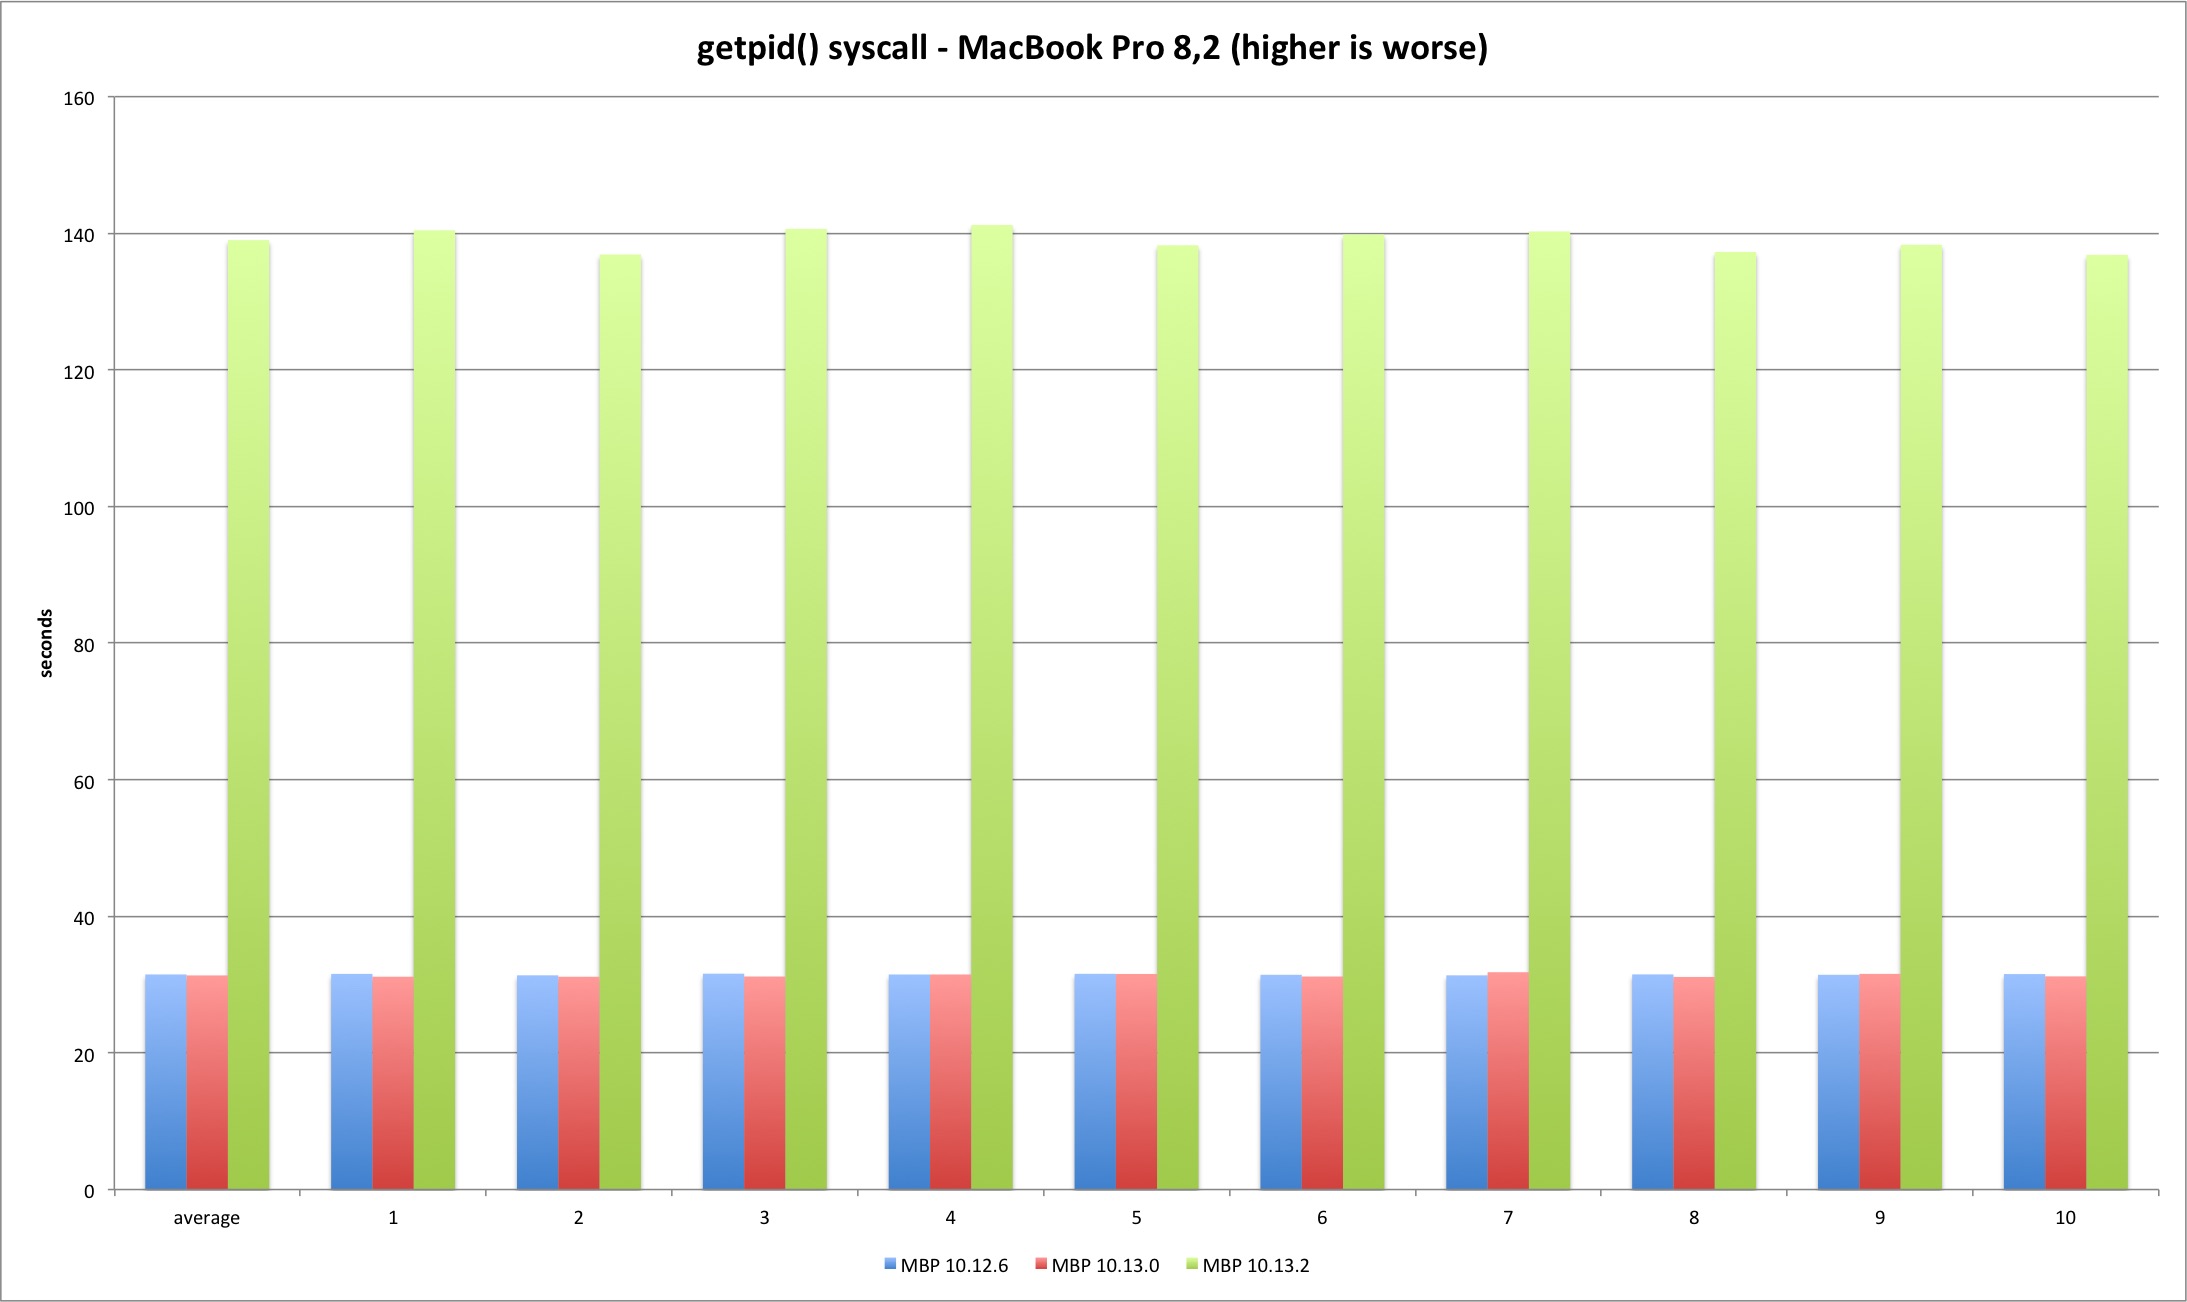
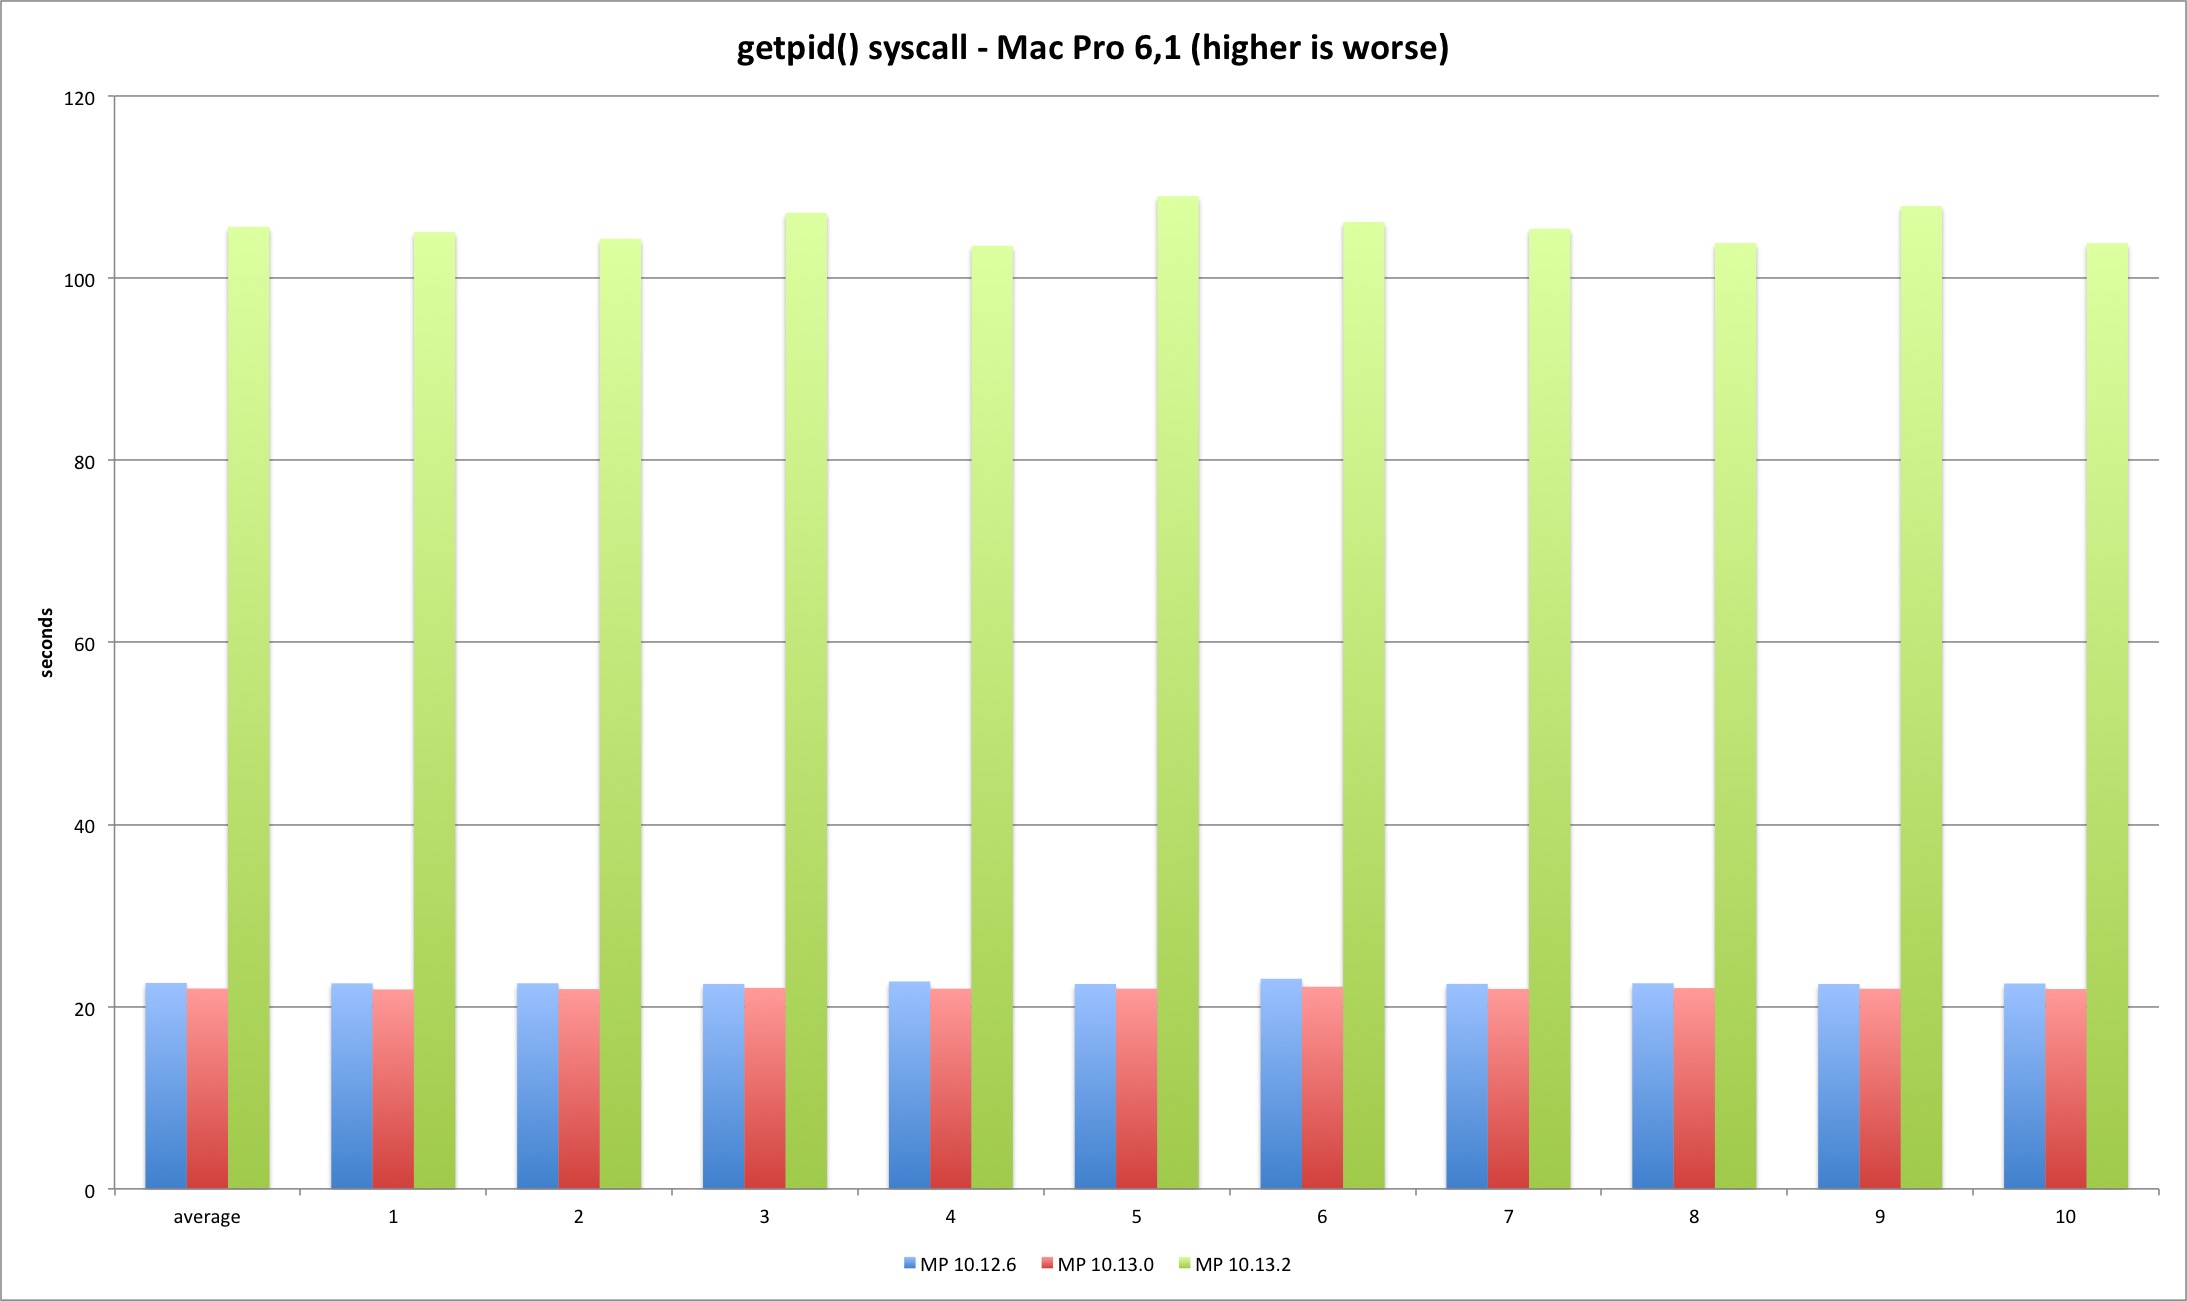
We can clearly observe this is where the fun starts. The 10.13.2 syscall is much slower versus previous versions. The fix introduces significant overhead at the syscall interface as expected. High Sierra 10.13.2 is more than 300% slower executing 250m getpid syscalls versus 10.13.0. Another test run executing only 50 million syscalls reveals the same variation - the performance loss is linear.
| MBP 10.13.0 vs 10.12.6 | MBP 10.13.2 vs 10.13.0 | MP 10.13.0 vs 10.12.6 | MP 10.13.2 vs 10.13.0 | |
|---|---|---|---|---|
| Average | -0,45% | 343,47% | -2,72% | 380,20% |
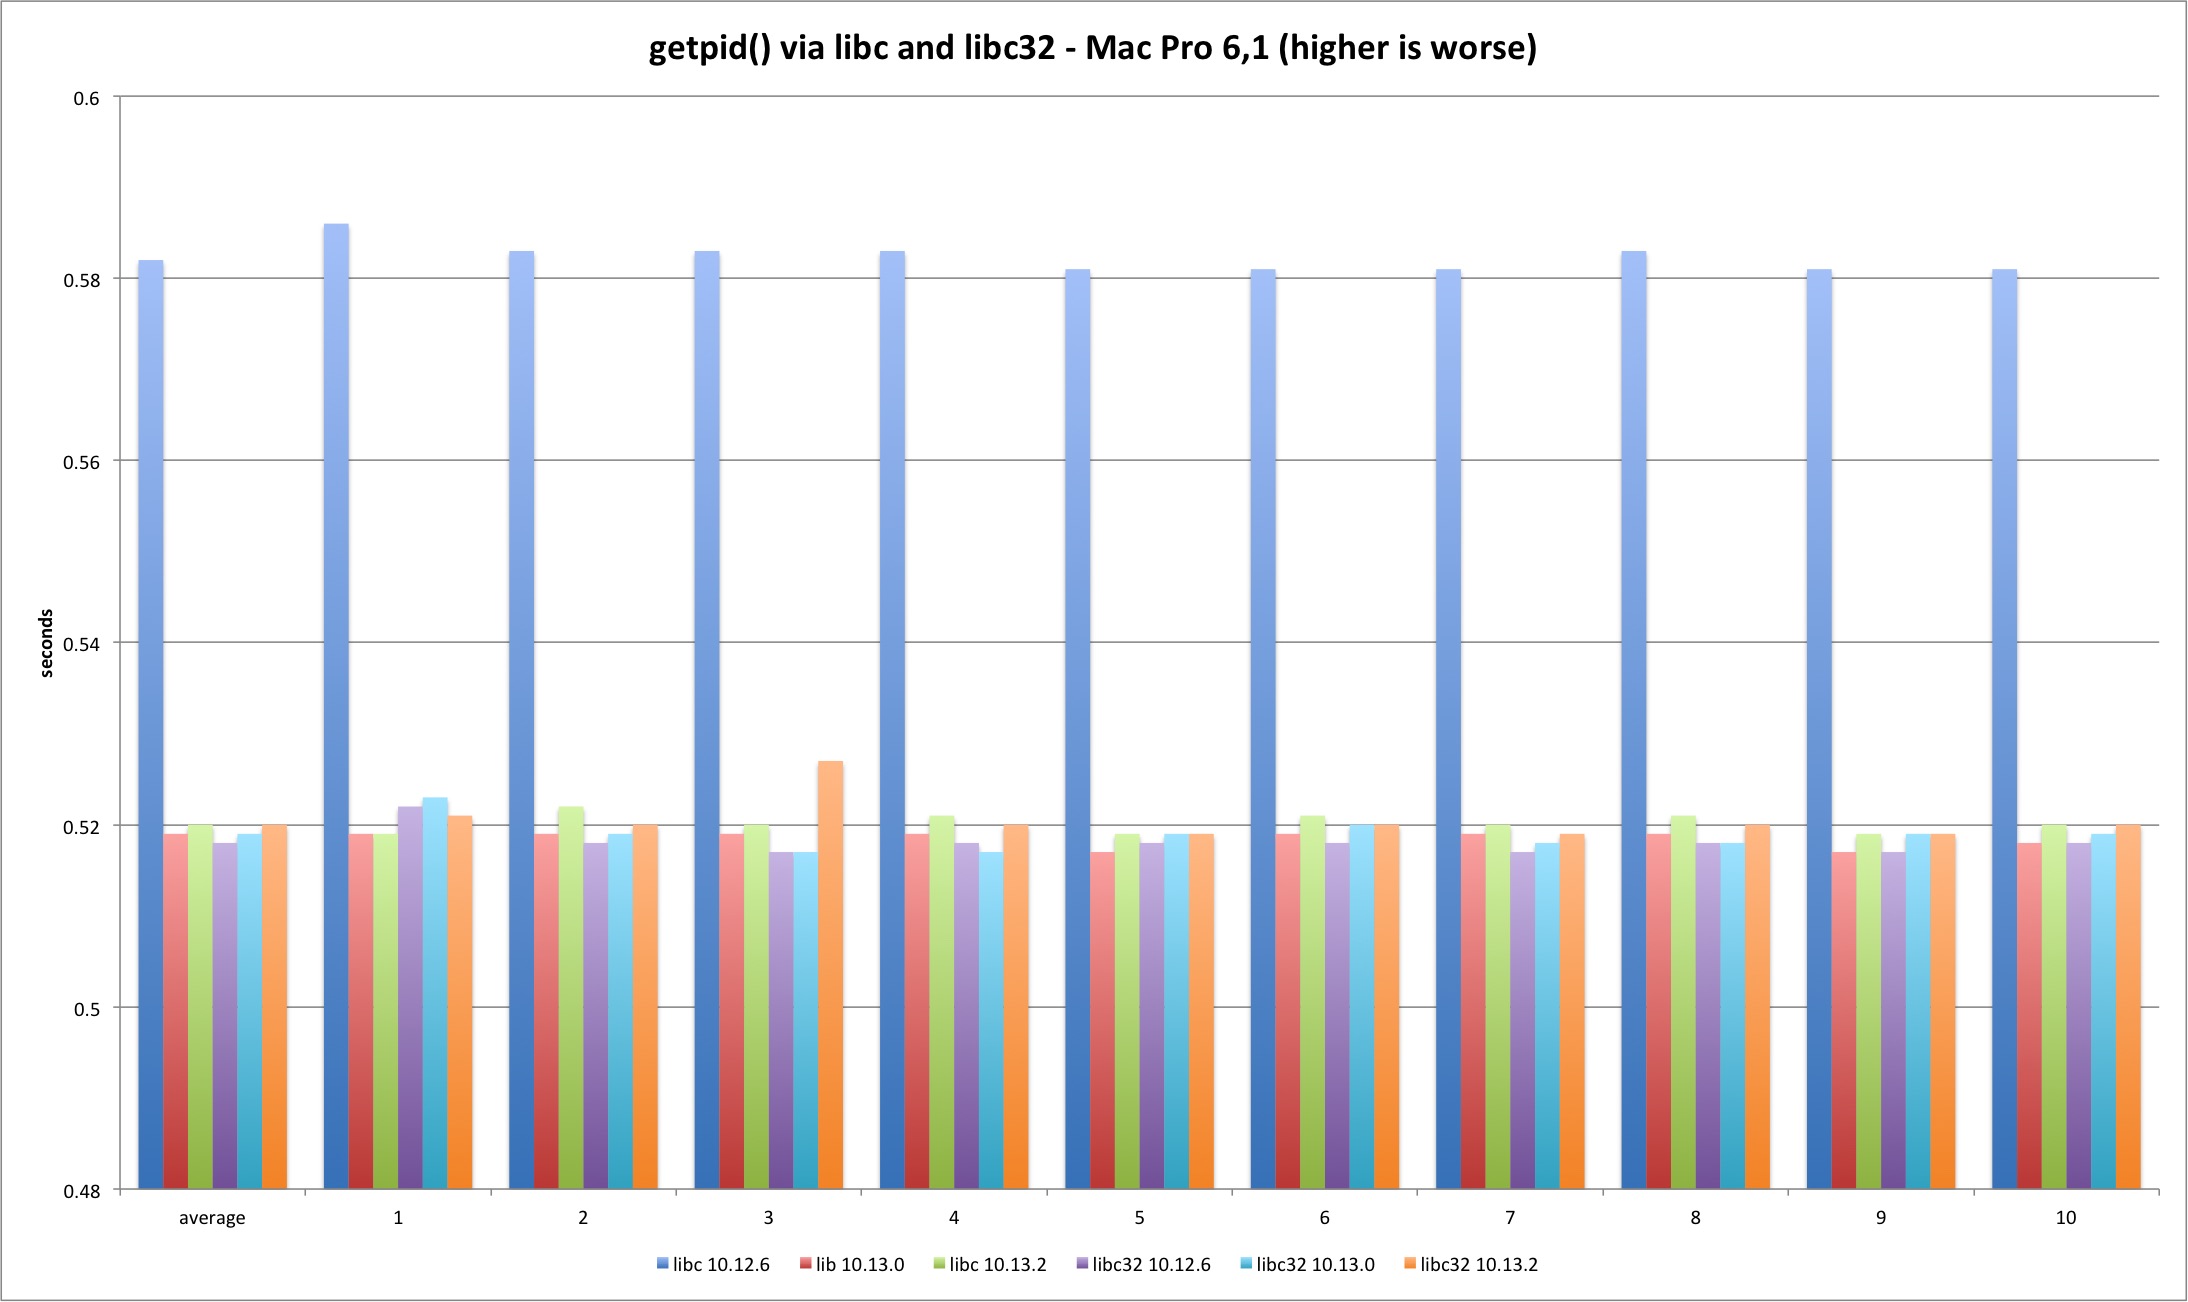
The getpid libsystem_kernel.dylib implementation is slightly more complex because it caches the current pid, avoiding the syscall after the caching. This explains the huge performance difference between the syscall and system library tests.
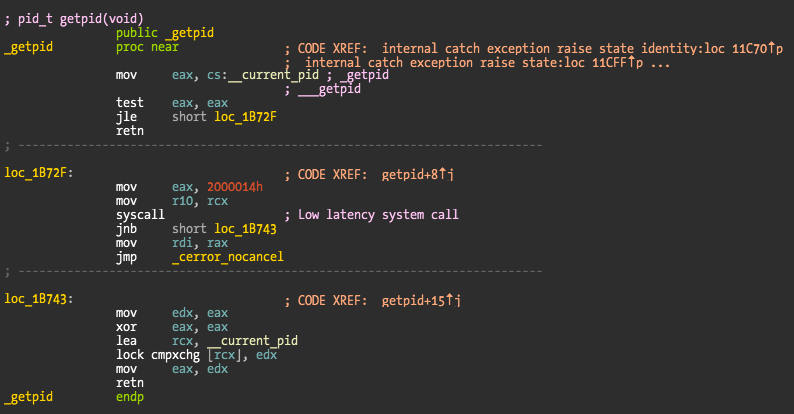
The results present an interesting detail. Somehow Sierra libc 64 bit binary has slightly higher overhead versus everything else. I have no idea why this is happening - the libsystem_kernel.dylib assembly code is exactly the same. We are talking about an irrelevant timing difference but it is still curious why both machines show the same pattern. It could be due to different process startup overhead since the test is very short.
The relevant conclusion is that there is no relevant difference between all library the versions since the libc code is all userland after the PID is cached, coherent with the placebo test.

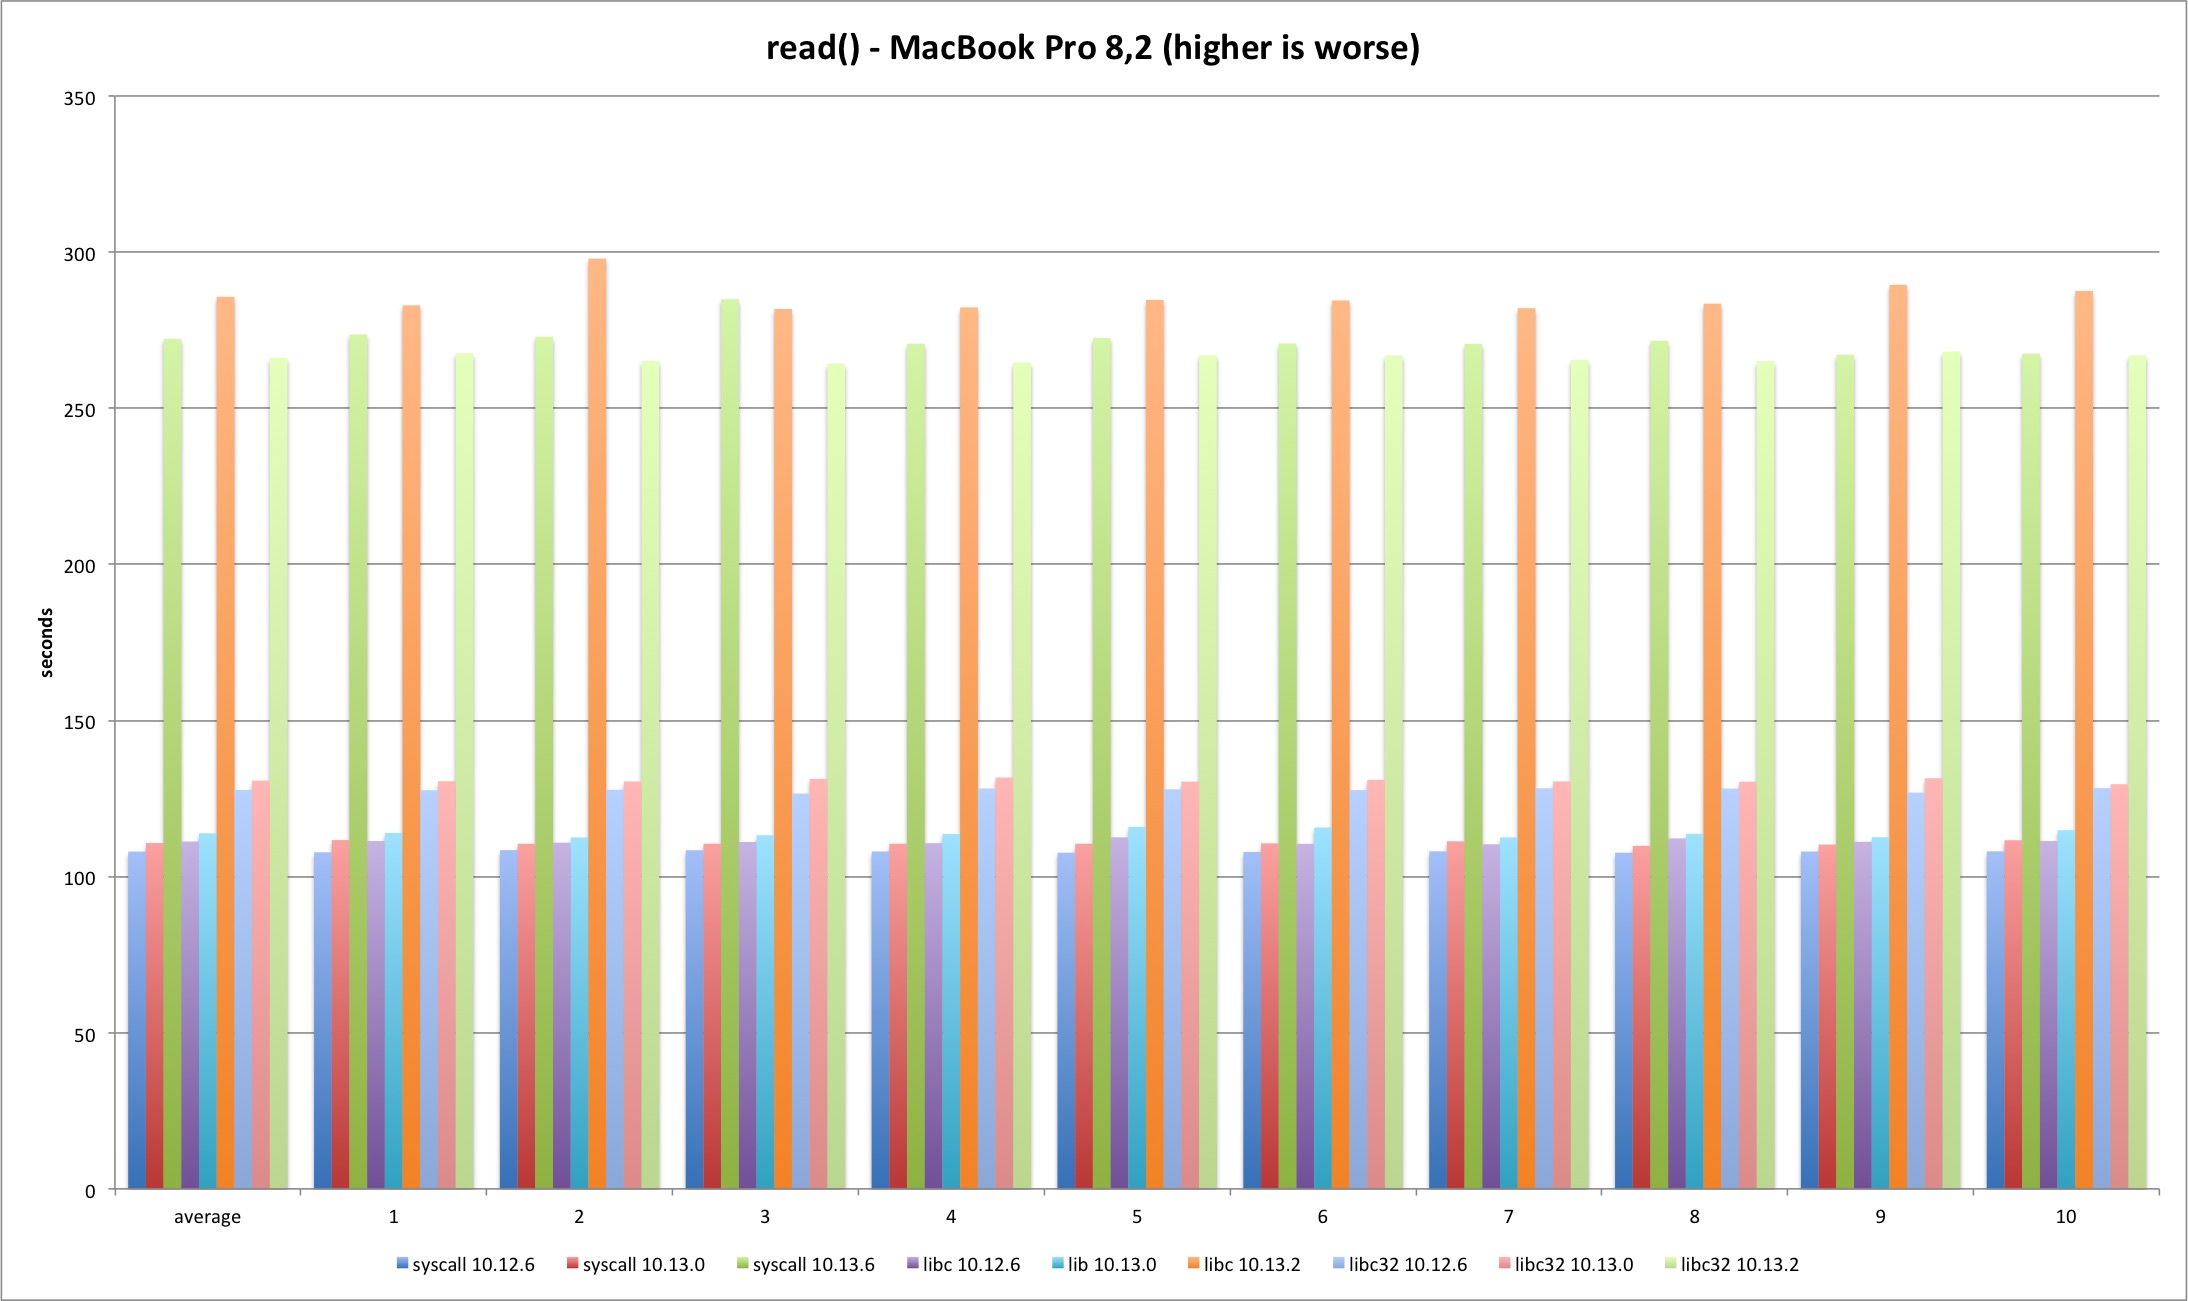
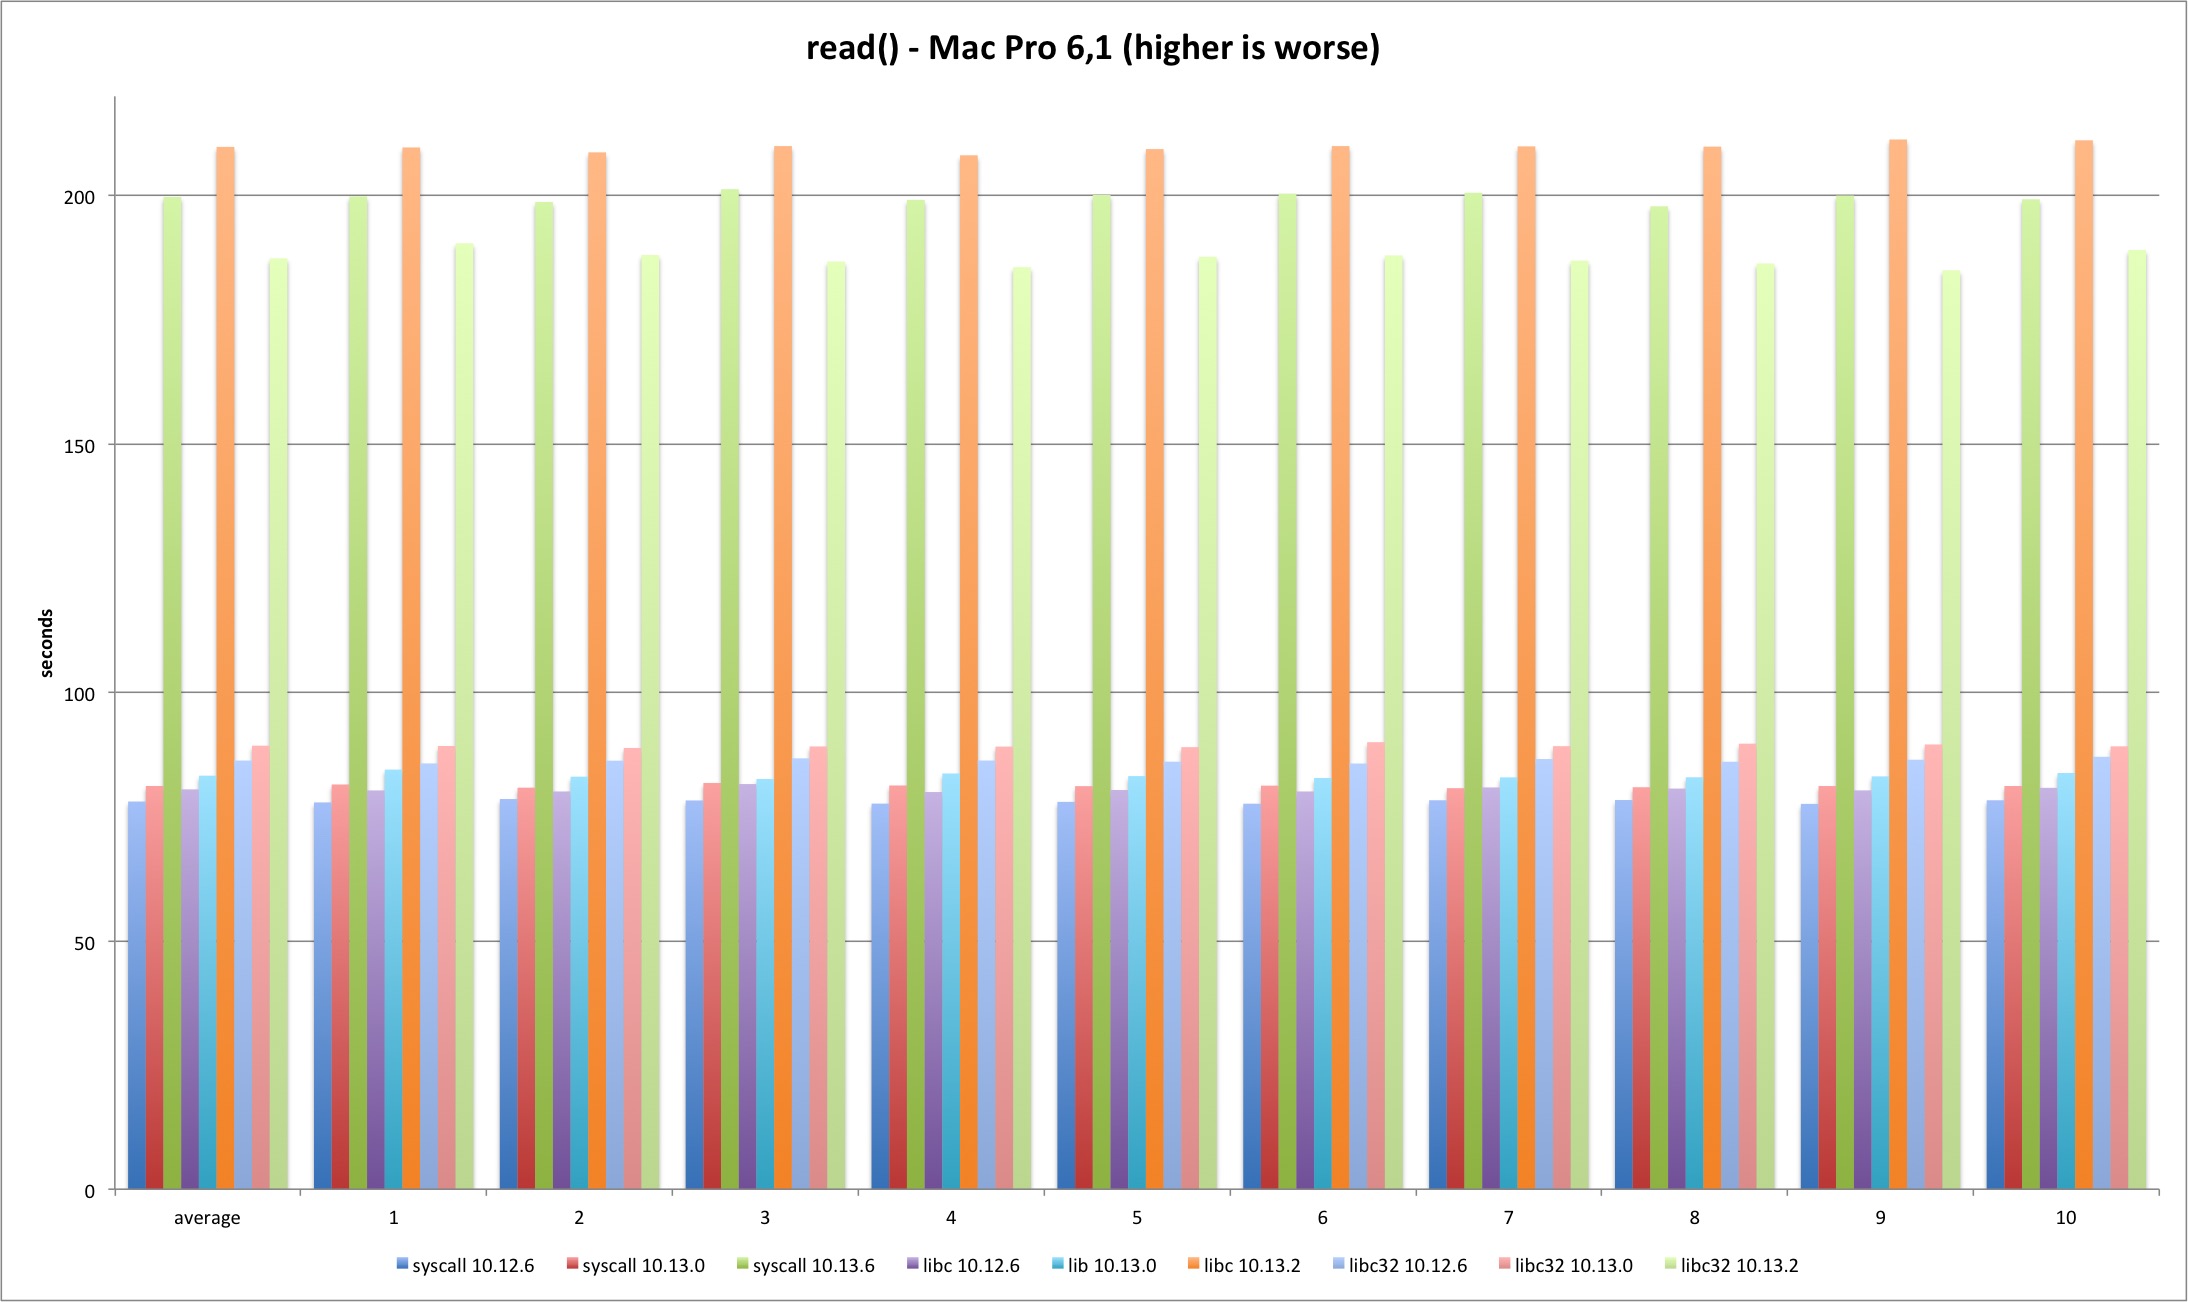
read
Next is the read syscall. The same loss pattern is observed on all tests although the loss is now around 140%. This time there is no visible improvement from Sierra to High Sierra (the test runs much longer so startup overhead is irrelevant). In 10.13.2 the 32 bits libc binary is faster than the other tests on both machines. Why?
| MBP 10.13.0 vs 10.12.6 | MBP 10.13.2 vs 10.13.0 | MP 10.13.0 vs 10.12.6 | MP 10.13.2 vs 10.13.0 | |
|---|---|---|---|---|
| syscall | 2,54% | 145,78% | 4,02% | 146,07% |
| libc | 2,38% | 150,86% | 3,42% | 152,07% |
| libc32 | 2,33% | 103,56% | 3,47% | 109,88% |
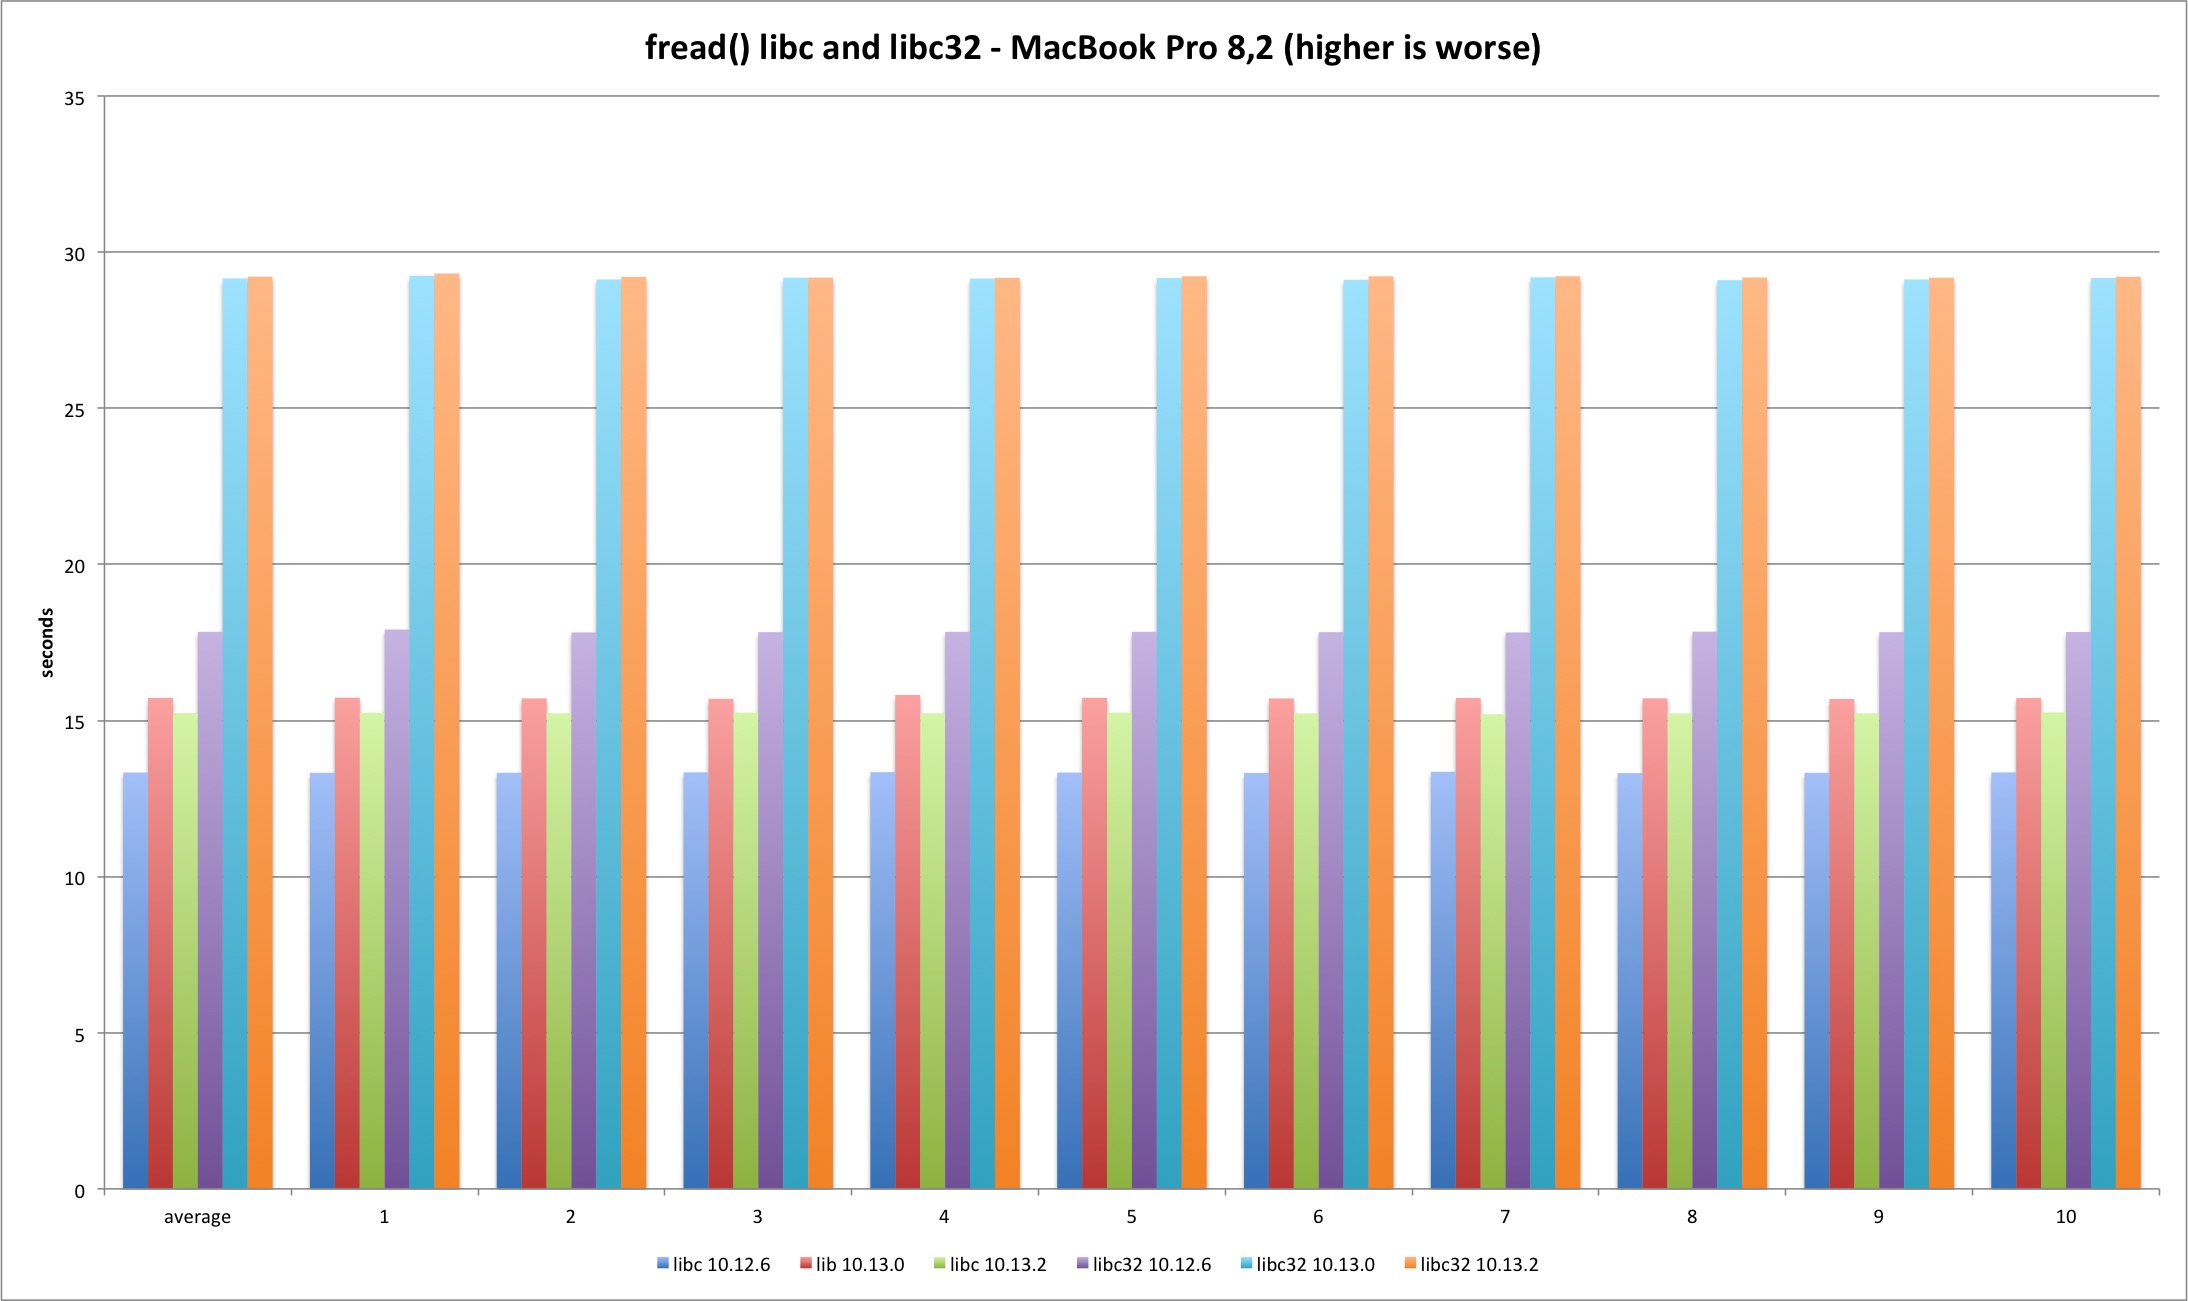
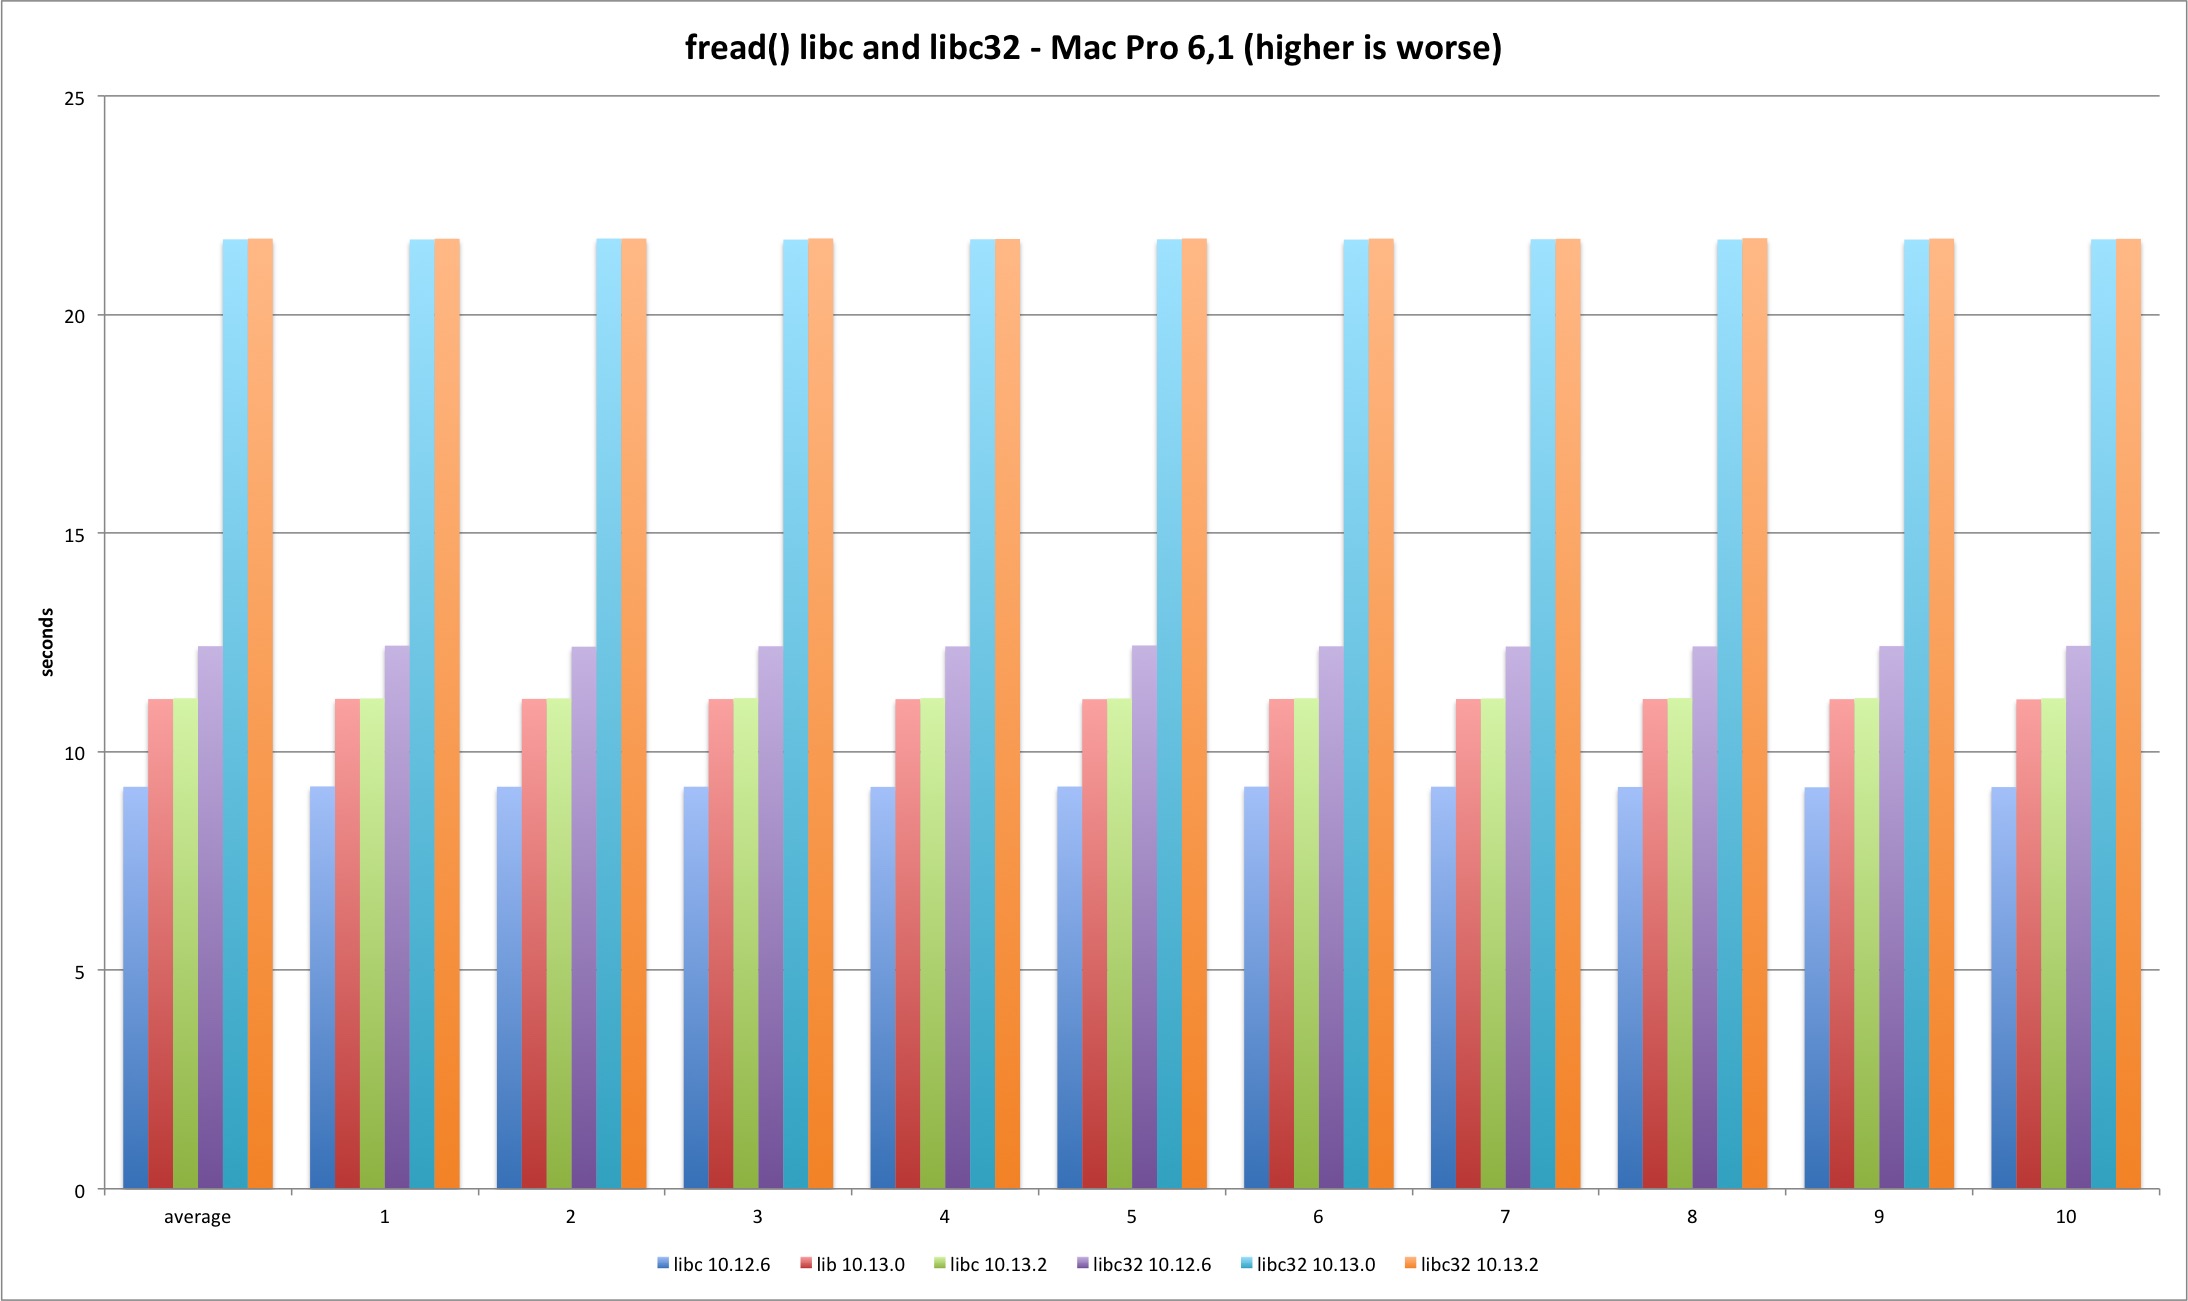
fread
The fread function is buffered and lives only in system libraries. It presents degradation in the transition from Sierra to High Sierra (why?) but the fix has no impact. The other interesting fact is the worse performance in 32 bits. If I had to guess I would blame the memory copy routines that are faster in 64 bits.
| MBP 10.13.0 vs 10.12.6 | MBP 10.13.2 vs 10.13.0 | MP 10.13.0 vs 10.12.6 | MP 10.13.2 vs 10.13.0 | |
|---|---|---|---|---|
| libc | 17,93% | -3,10% | 21,83% | 0,16% |
| libc32 | 63,44% | 0,19% | 74,98% | 0,08% |
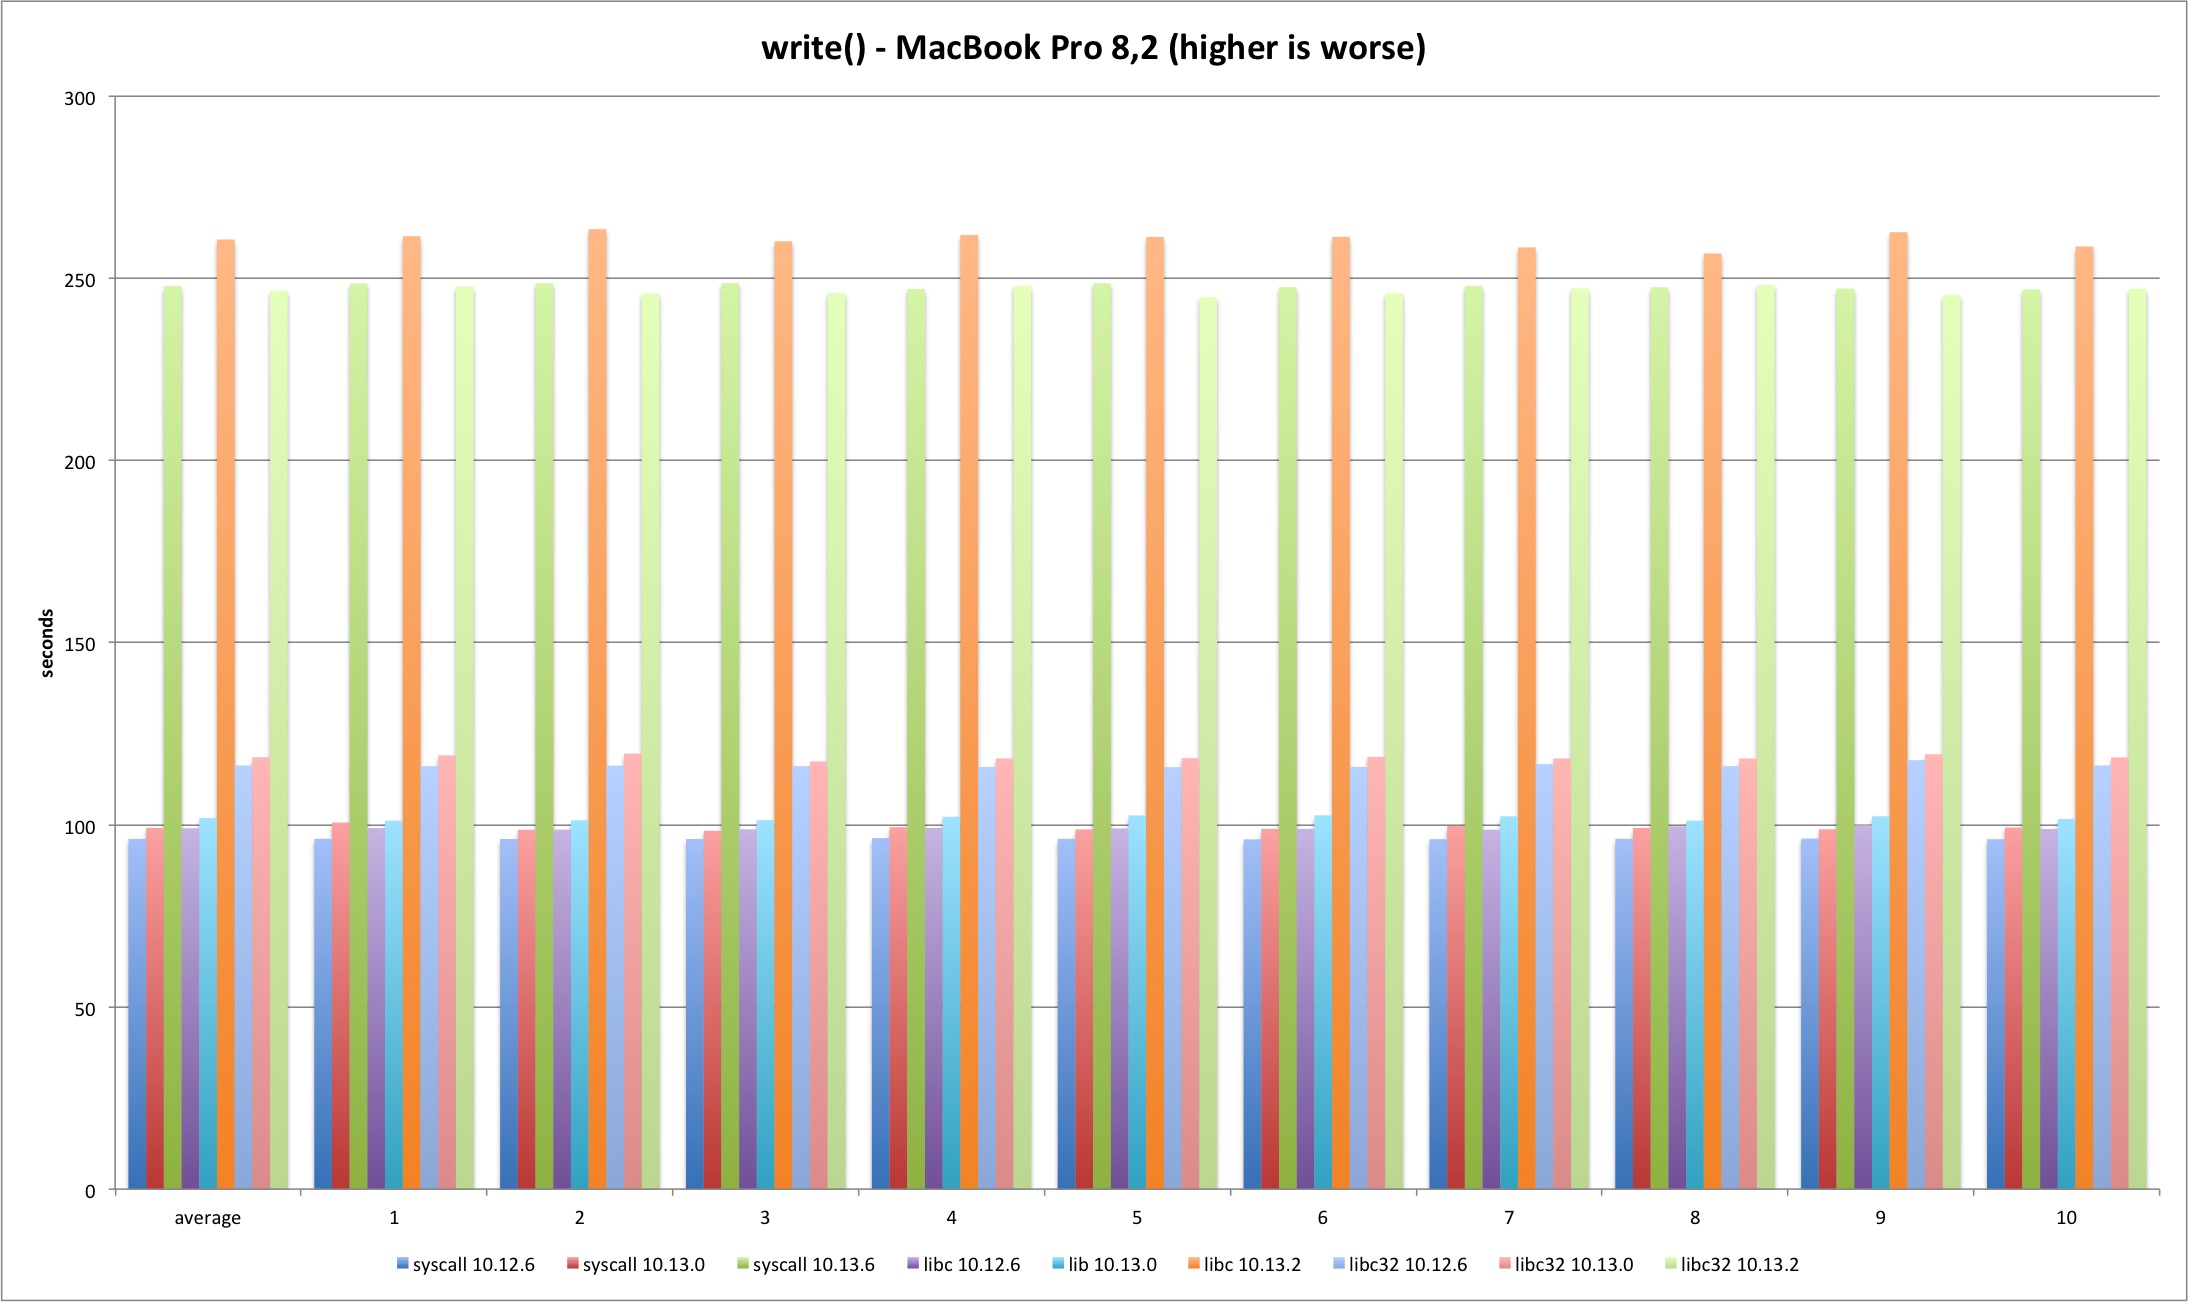
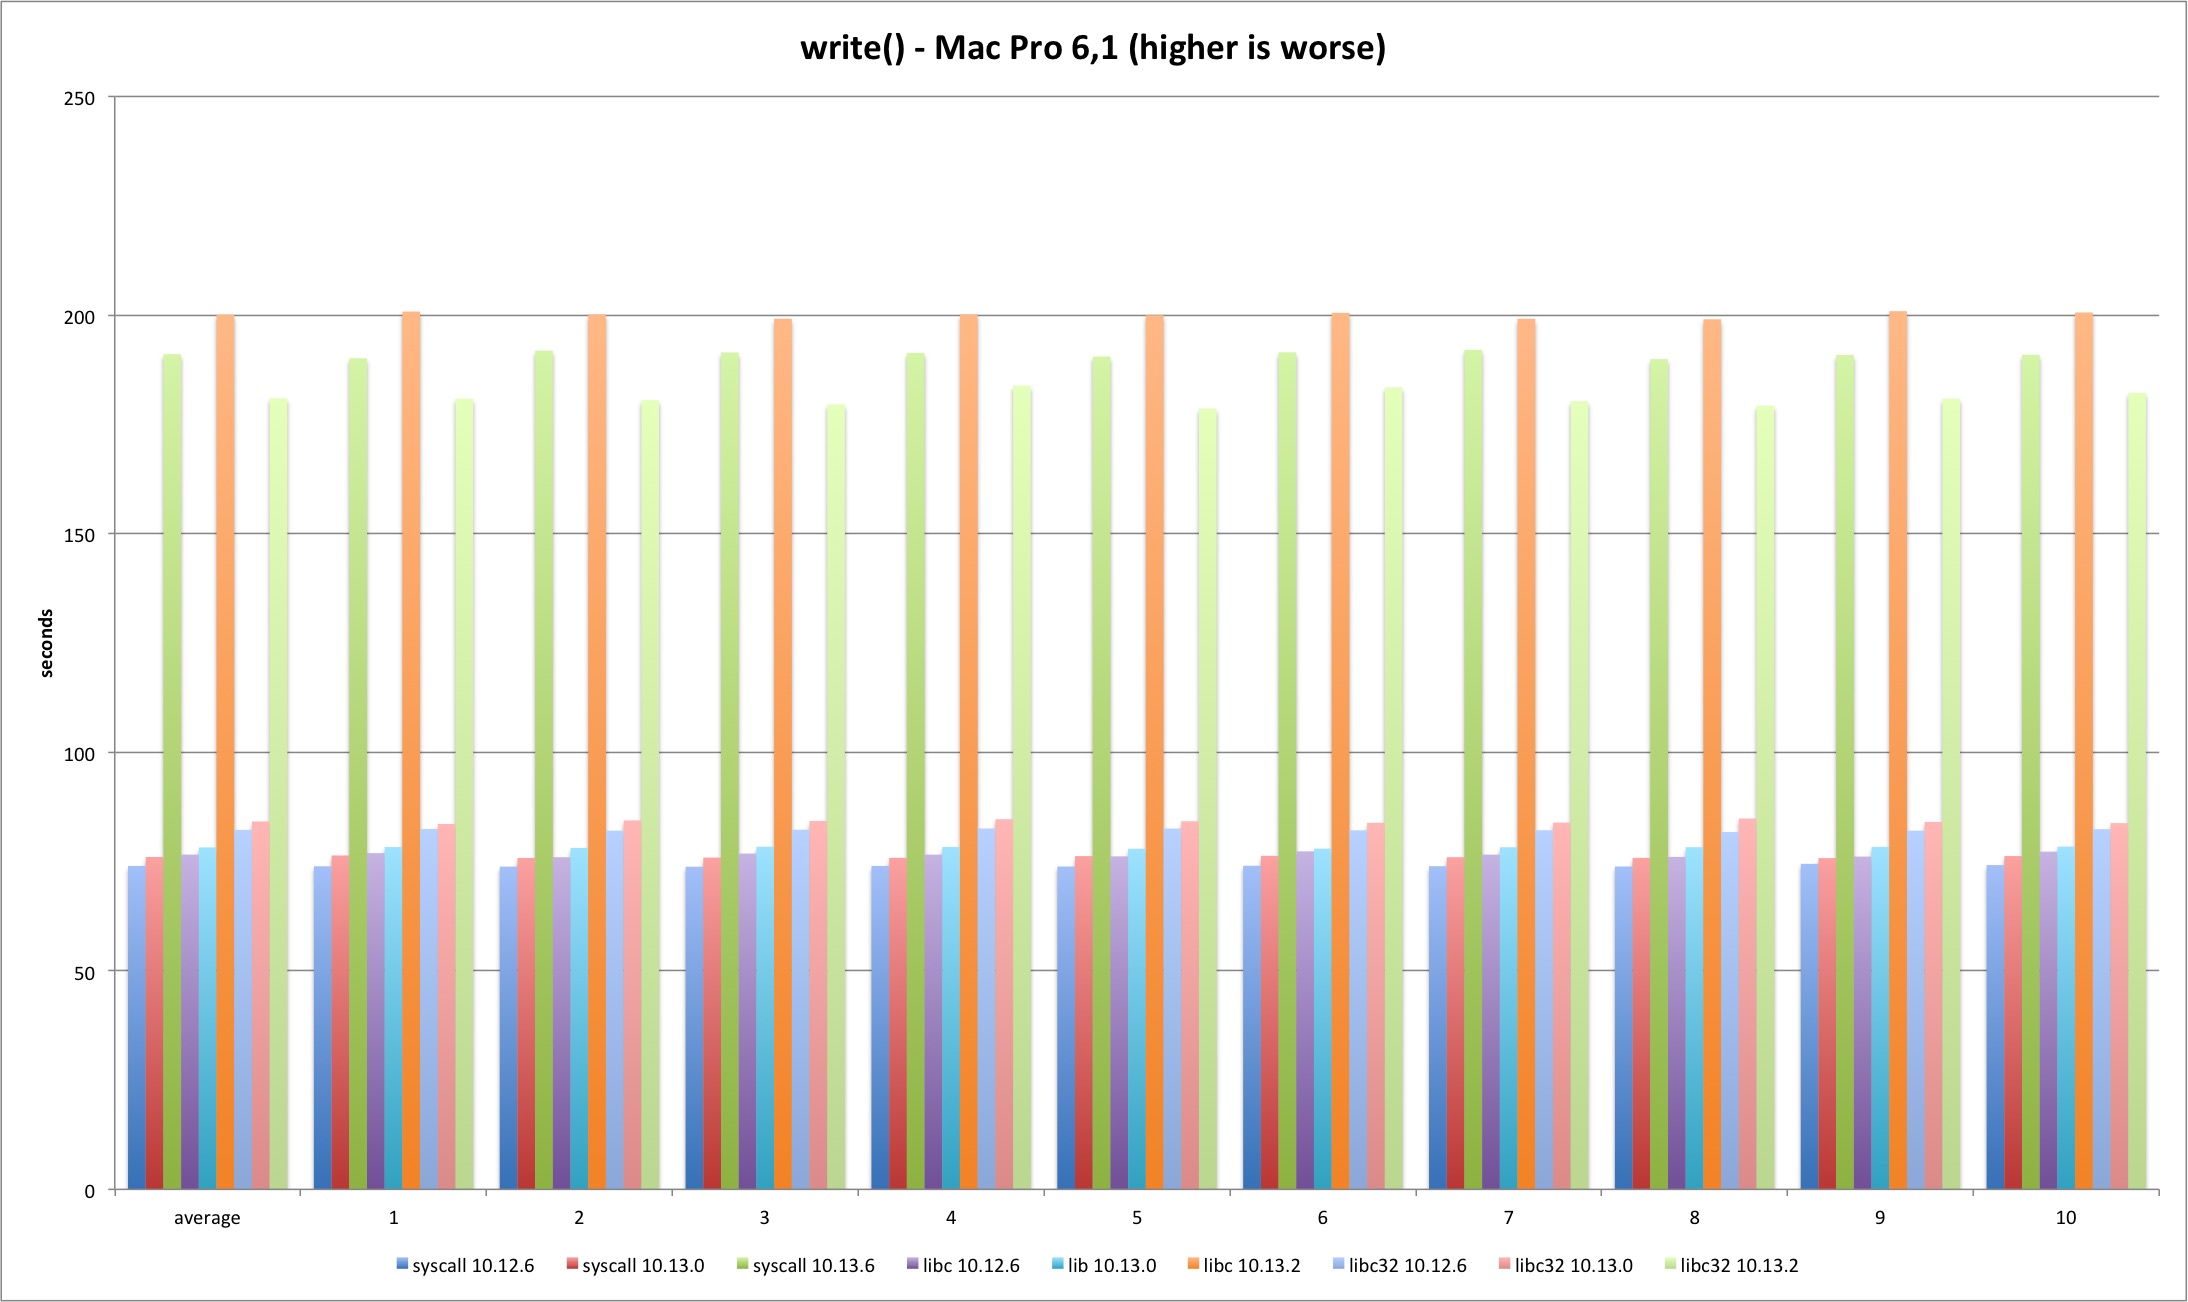
write
The write results are in line with read results, just slightly worse.
| MBP 10.13.0 vs 10.12.6 | MBP 10.13.2 vs 10.13.0 | MP 10.13.0 vs 10.12.6 | MP 10.13.2 vs 10.13.0 | |
|---|---|---|---|---|
| syscall | 3,13% | 150,02% | 2,76% | 151,30% |
| libc | 2,82% | 155,93% | 2,15% | 155,73% |
| libc32 | 1,95% | 108,04% | 2,34% | 115,03% |
fwrite
The fwrite results are also in line with fread so I’ll just show the variation between the different versions. They are clearly similar to fread variations.
| MBP 10.13.0 vs 10.12.6 | MBP 10.13.2 vs 10.13.0 | MP 10.13.0 vs 10.12.6 | MP 10.13.2 vs 10.13.0 | |
|---|---|---|---|---|
| libc | 11,30% | -2,88% | 19,86% | 0,12% |
| libc32 | 62,51% | -0,84% | 72,73% | 0,09% |
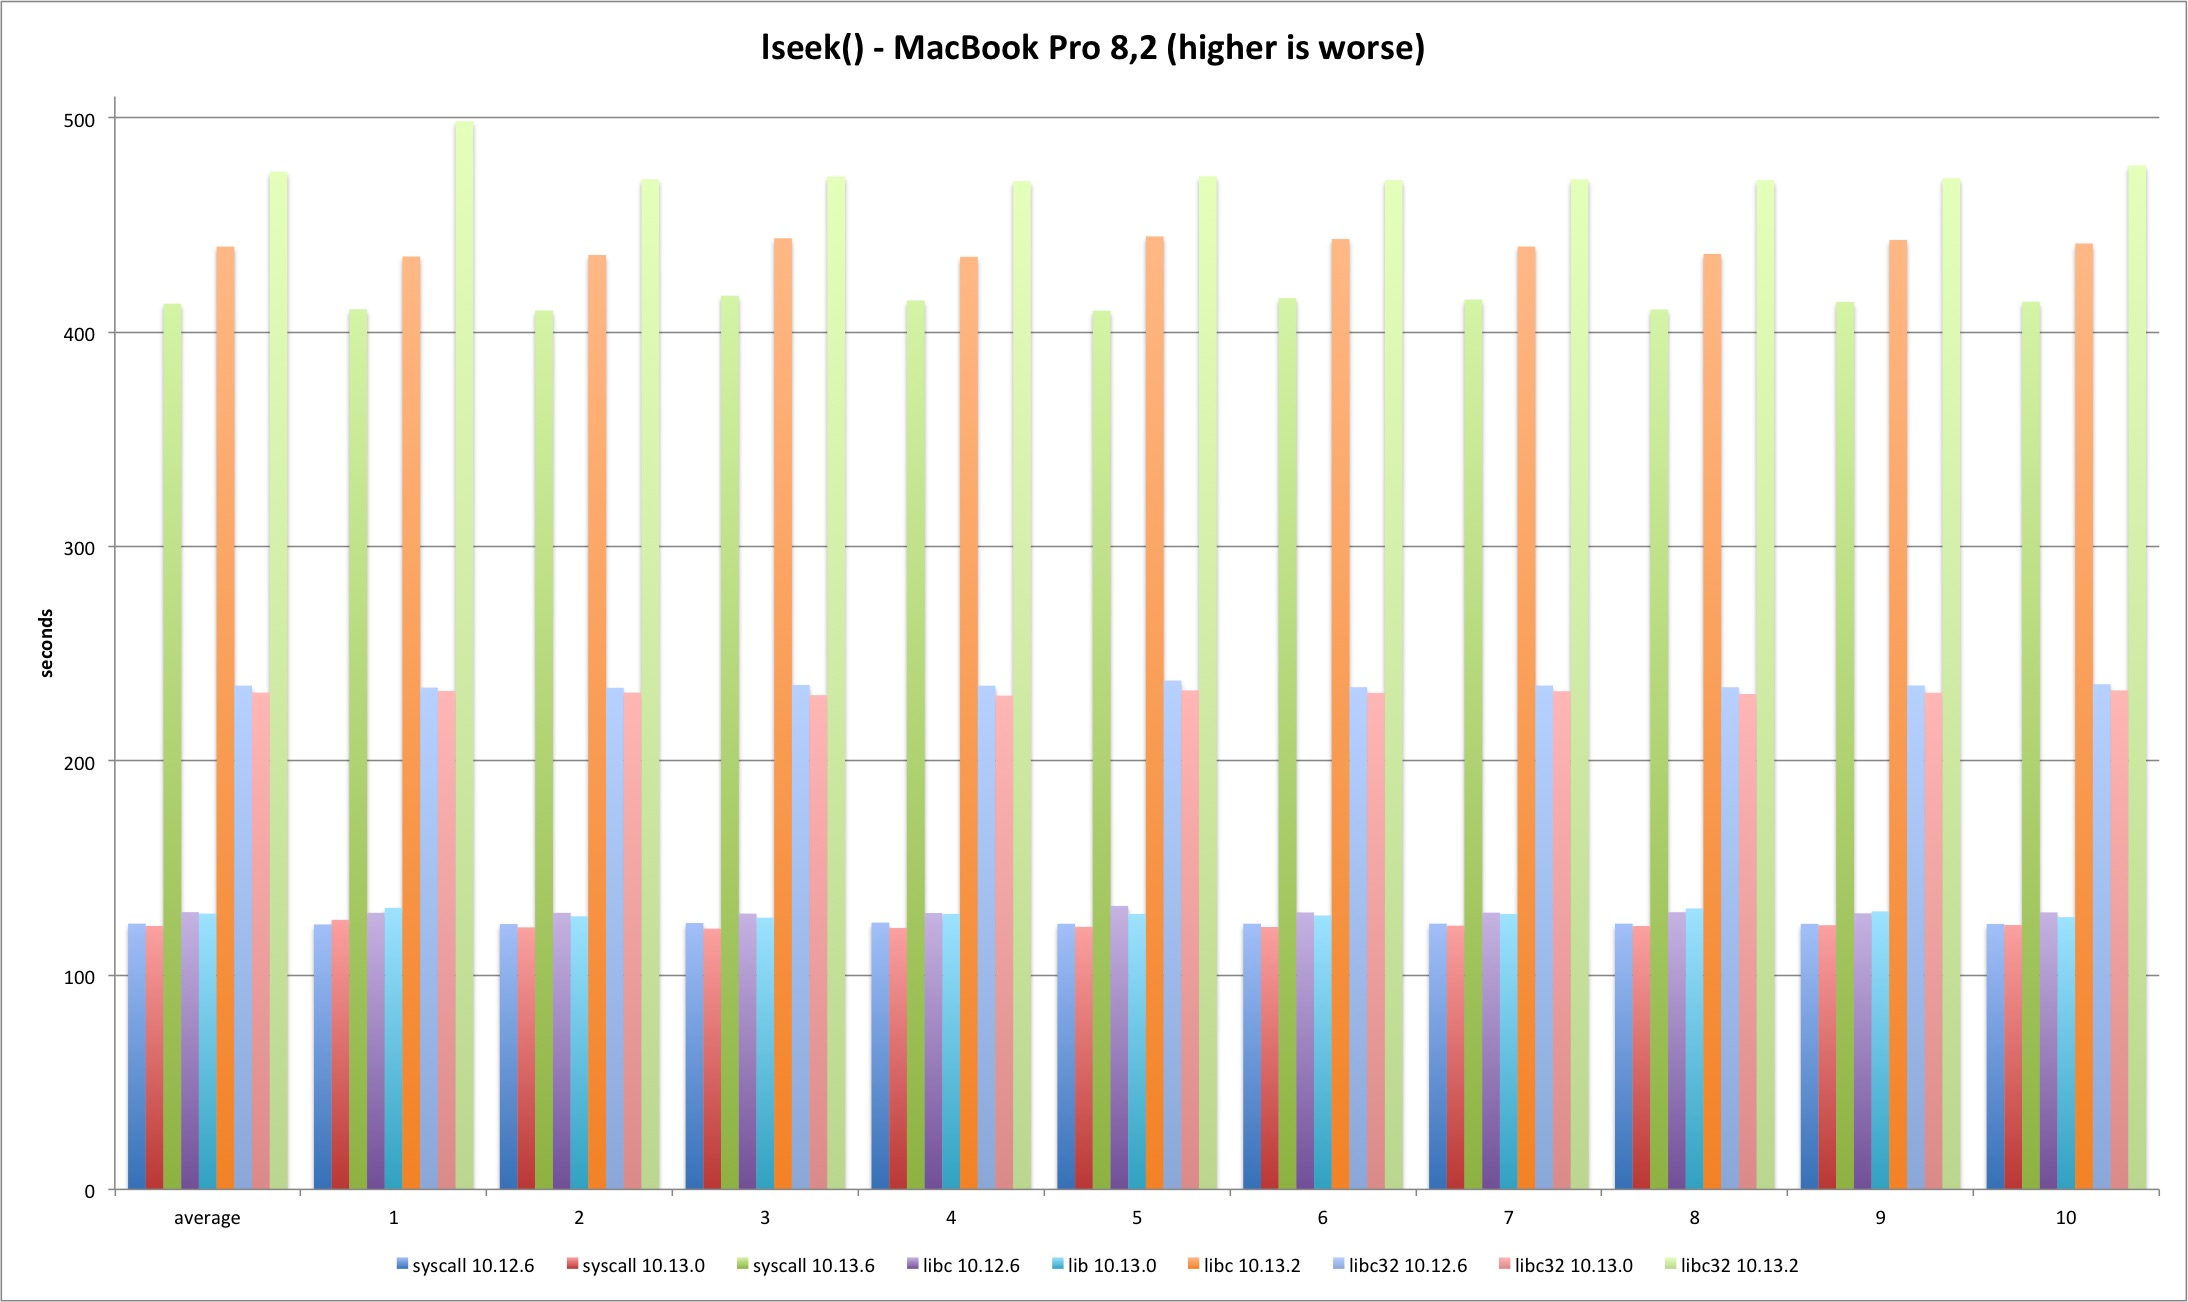
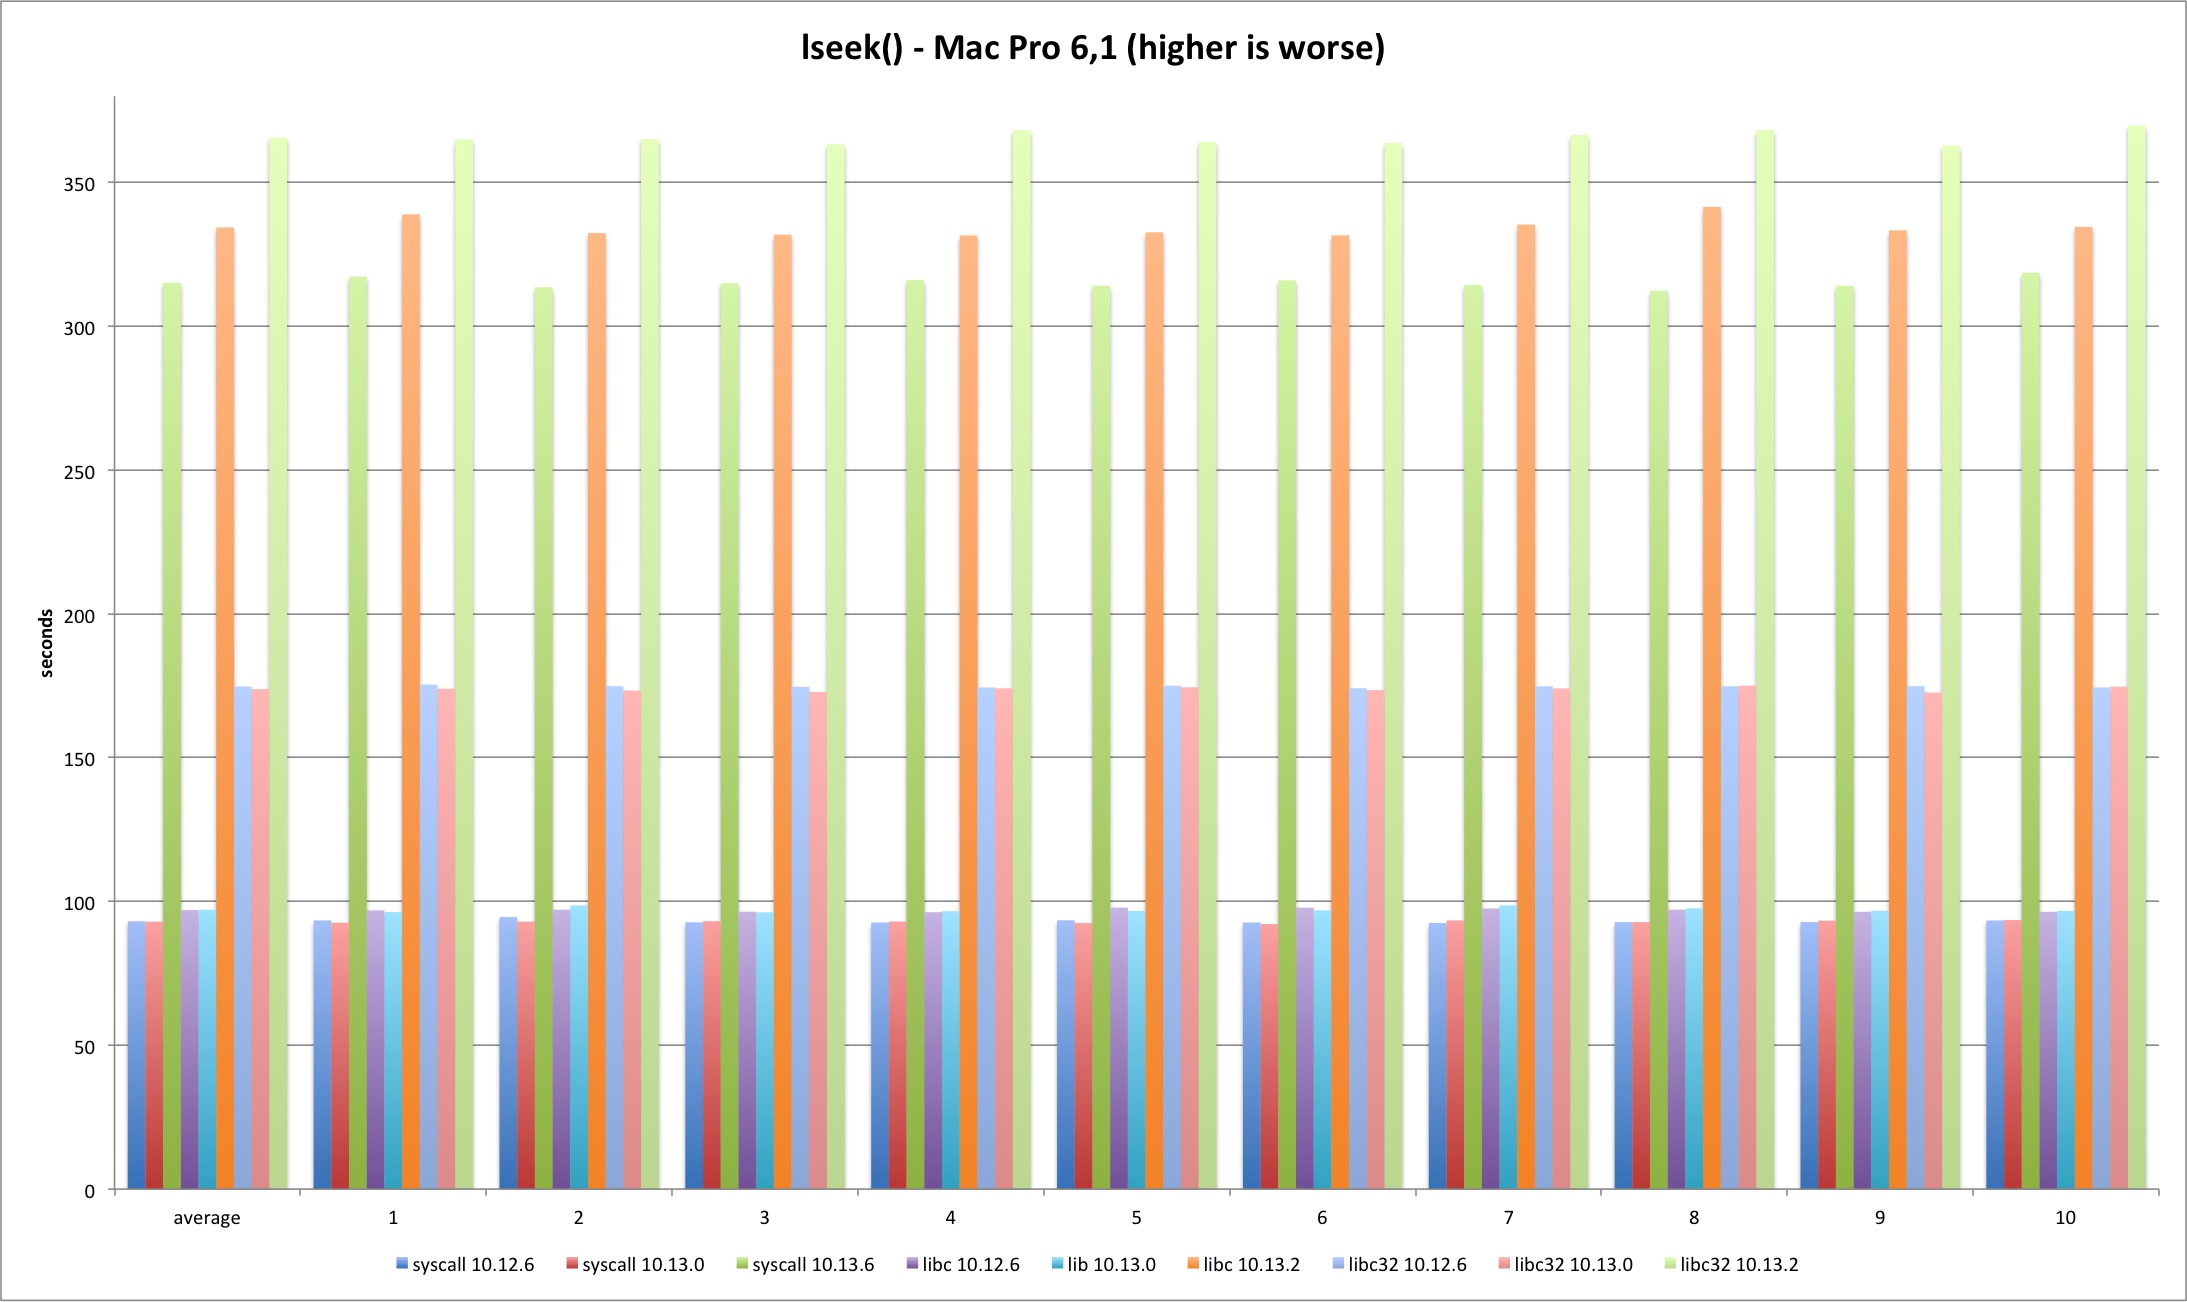
lseek
For the lseek test I decided to do two SEEK_SET per test, one 4 bytes ahead and then reset back to zero. The pattern holds and 10.13.2 test times are much longer, more than 200%. The difference is smaller in 32 bits because it was already 50% slower than 64 bit and syscall versions.
| MBP 10.13.0 vs 10.12.6 | MBP 10.13.2 vs 10.13.0 | MP 10.13.0 vs 10.12.6 | MP 10.13.2 vs 10.13.0 | |
|---|---|---|---|---|
| syscall | -0,86% | 236,18% | -0,17% | 239,02% |
| libc | -0,54% | 241,88% | 0,12% | 244,32% |
| libc32 | -1,39% | 104,85% | -0,50% | 110,32% |
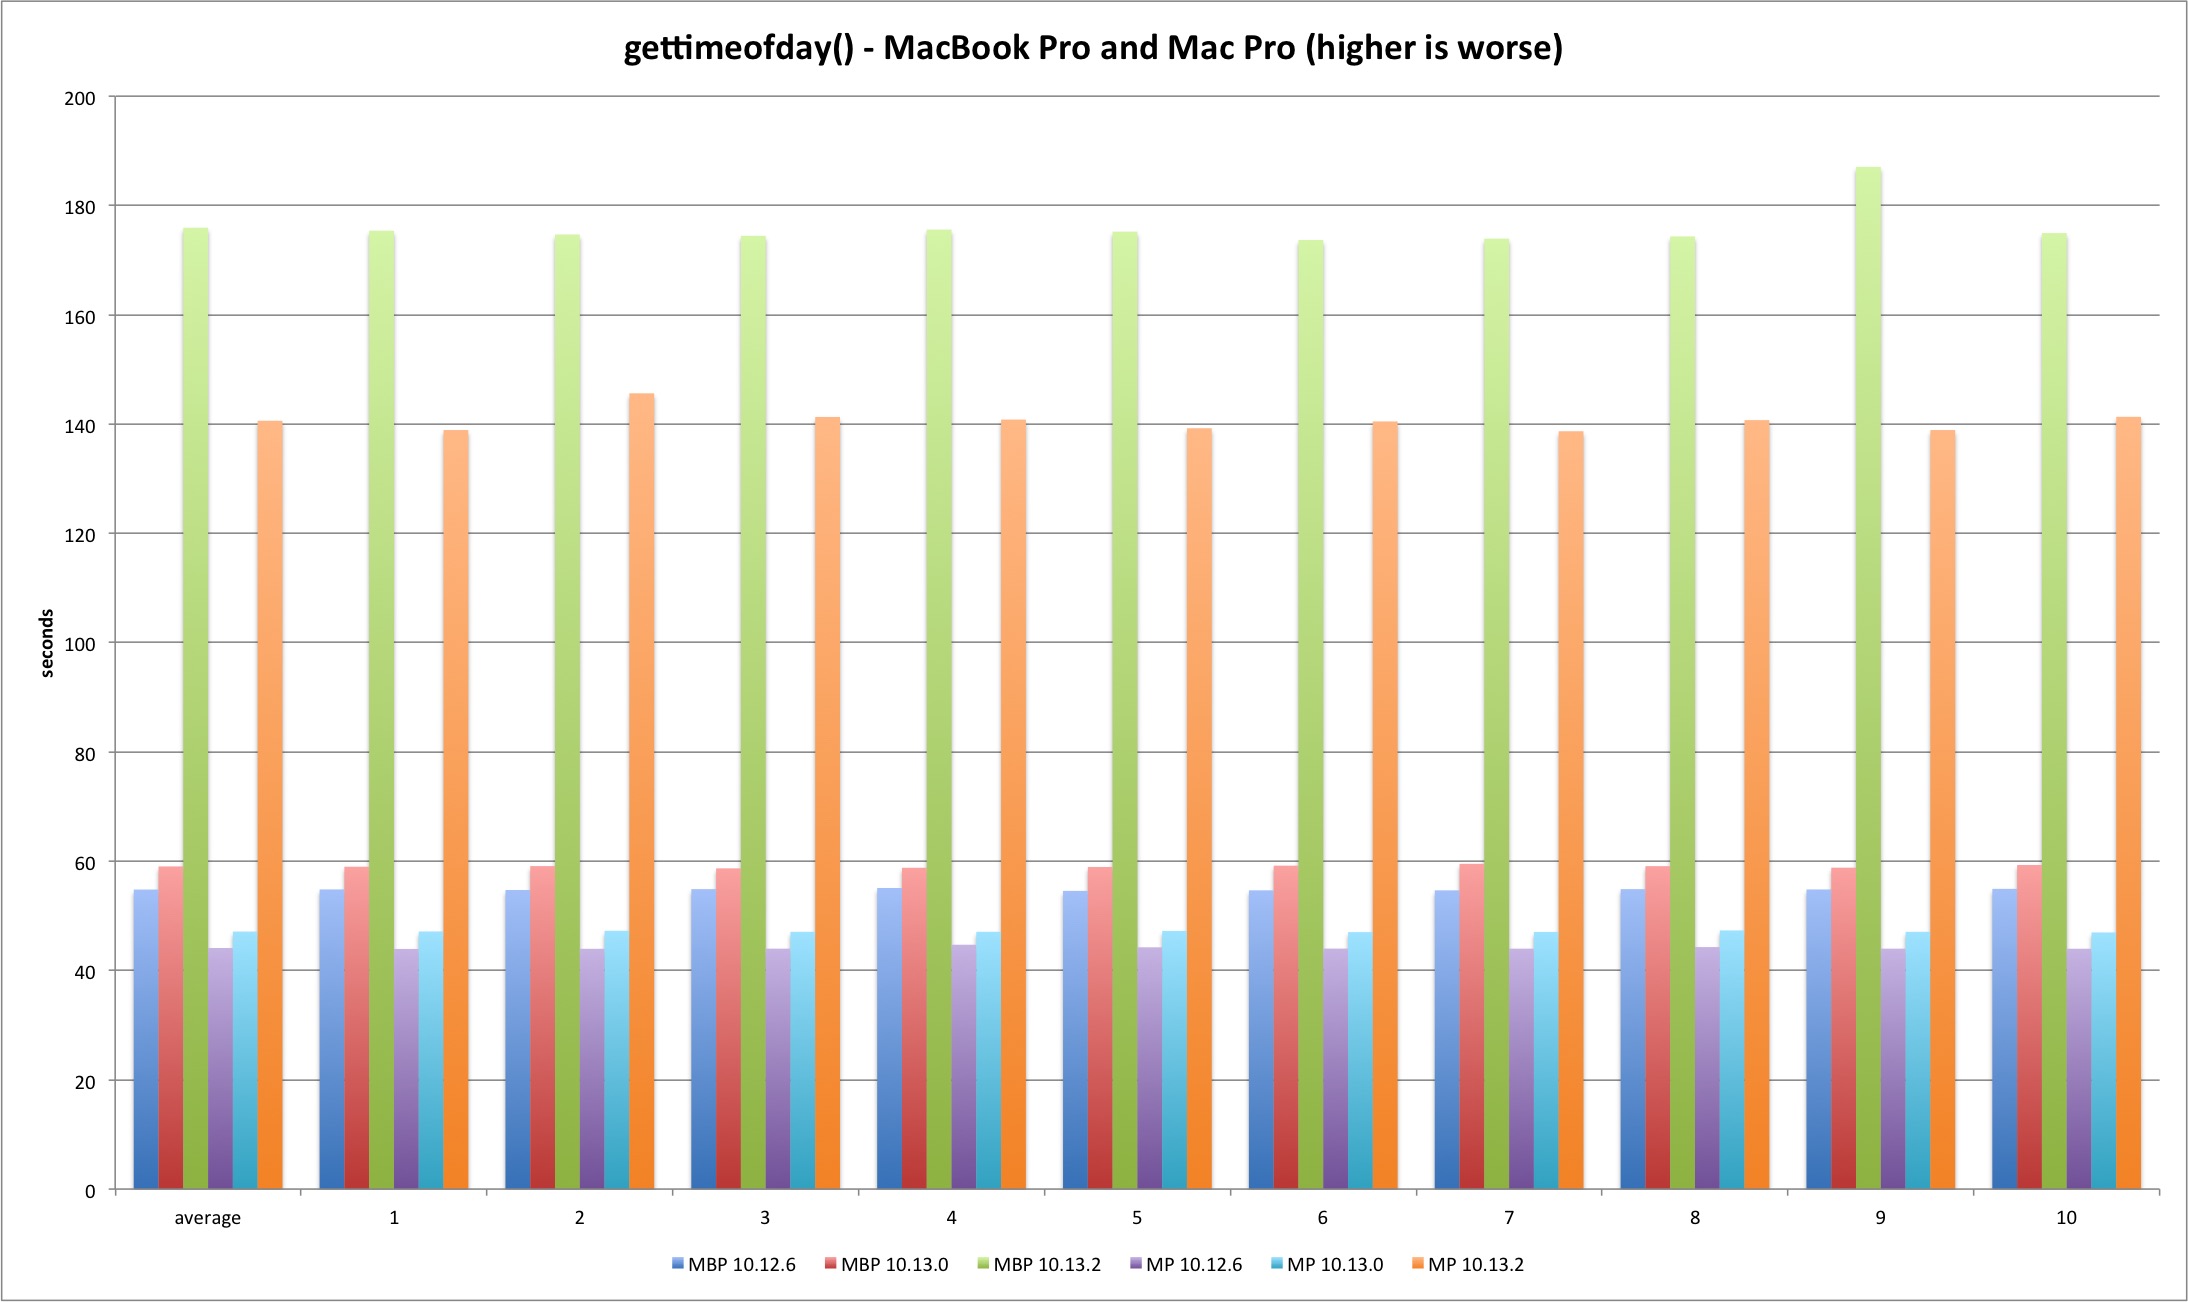
gettimeofday
Last but not least is gettimeofday. The system library implementation doesn’t always uses the syscall and that explains the better performance versus system call test. The trick is using the commpage to avoid a full syscall transition.
int gettimeofday (struct timeval *tp, void *vtzp)
{
	static int validtz = 0;
	static struct timezone cached_tz = {0};
	struct timezone *tzp = (struct timezone *)vtzp;
	struct timeval atv;

	if (tp == NULL) {
	    if (tzp == NULL)
		return	(0);
	    tp = &atv;
	}

	if (__commpage_gettimeofday(tp)) {		/* first try commpage */
		if (__gettimeofday(tp, NULL) < 0) {	/* if it fails, use syscall */
			return (-1);
		}
	}

	if (tzp) {
	    if (validtz == 0)  {
		struct tm *localtm = localtime ((time_t *)&tp->tv_sec);
		cached_tz.tz_dsttime = localtm->tm_isdst;
		cached_tz.tz_minuteswest =
		    (-localtm->tm_gmtoff / SECSPERMIN) +
		    (localtm->tm_isdst * MINSPERHOUR);
		validtz = 1;
	    }
	    tzp->tz_dsttime = cached_tz.tz_dsttime;
	    tzp->tz_minuteswest = cached_tz.tz_minuteswest;
	}
	return (0);
}
There is a performance improvement from Sierra to High Sierra in the 64 bits version.
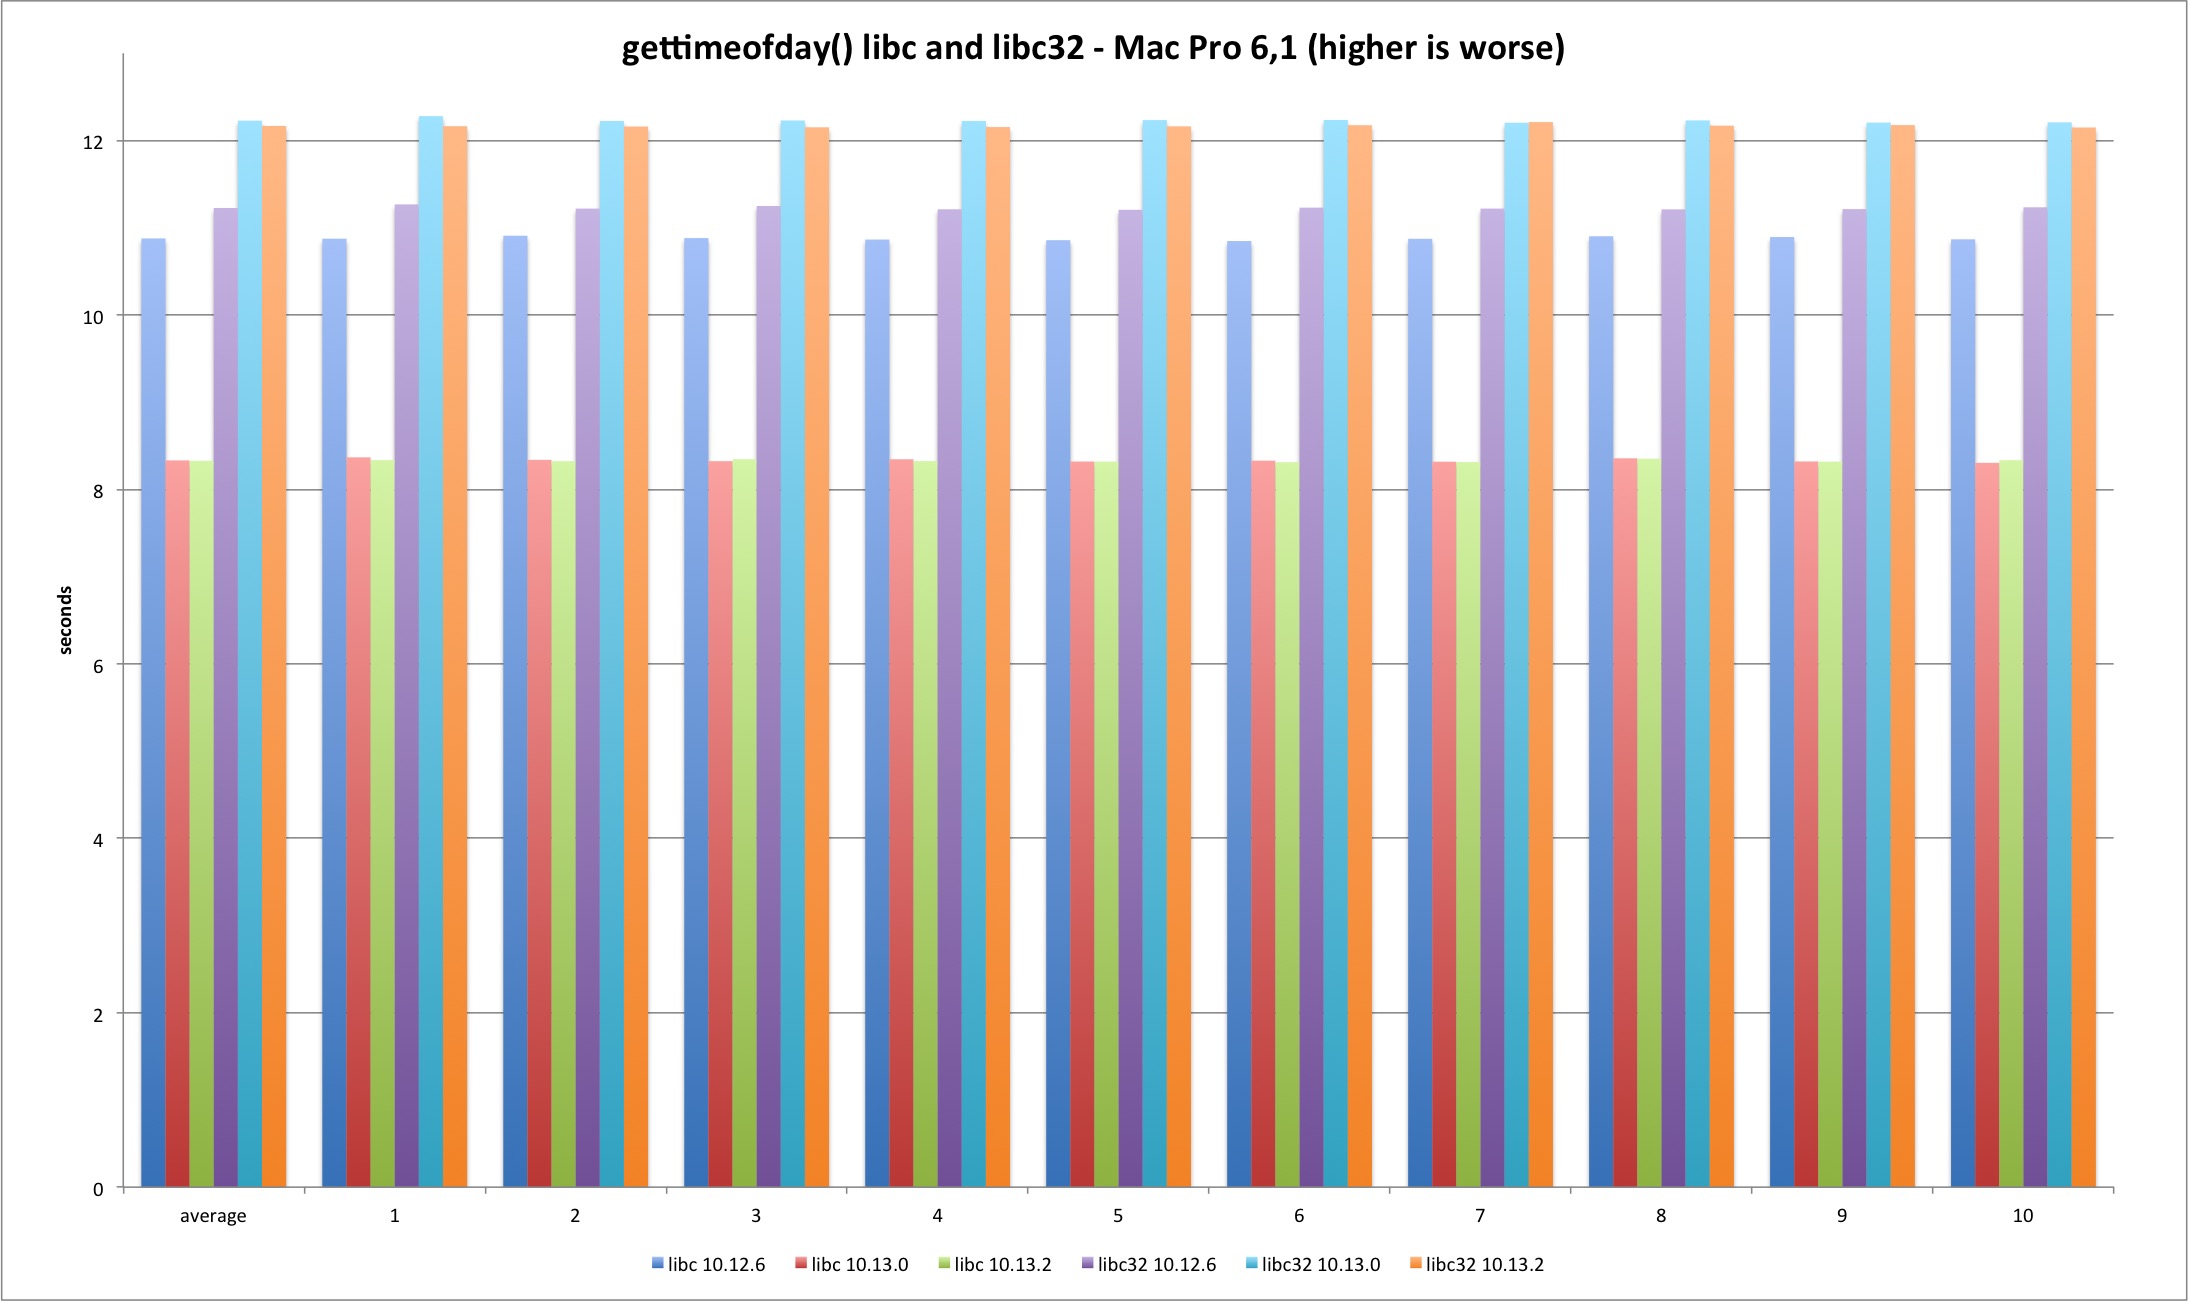
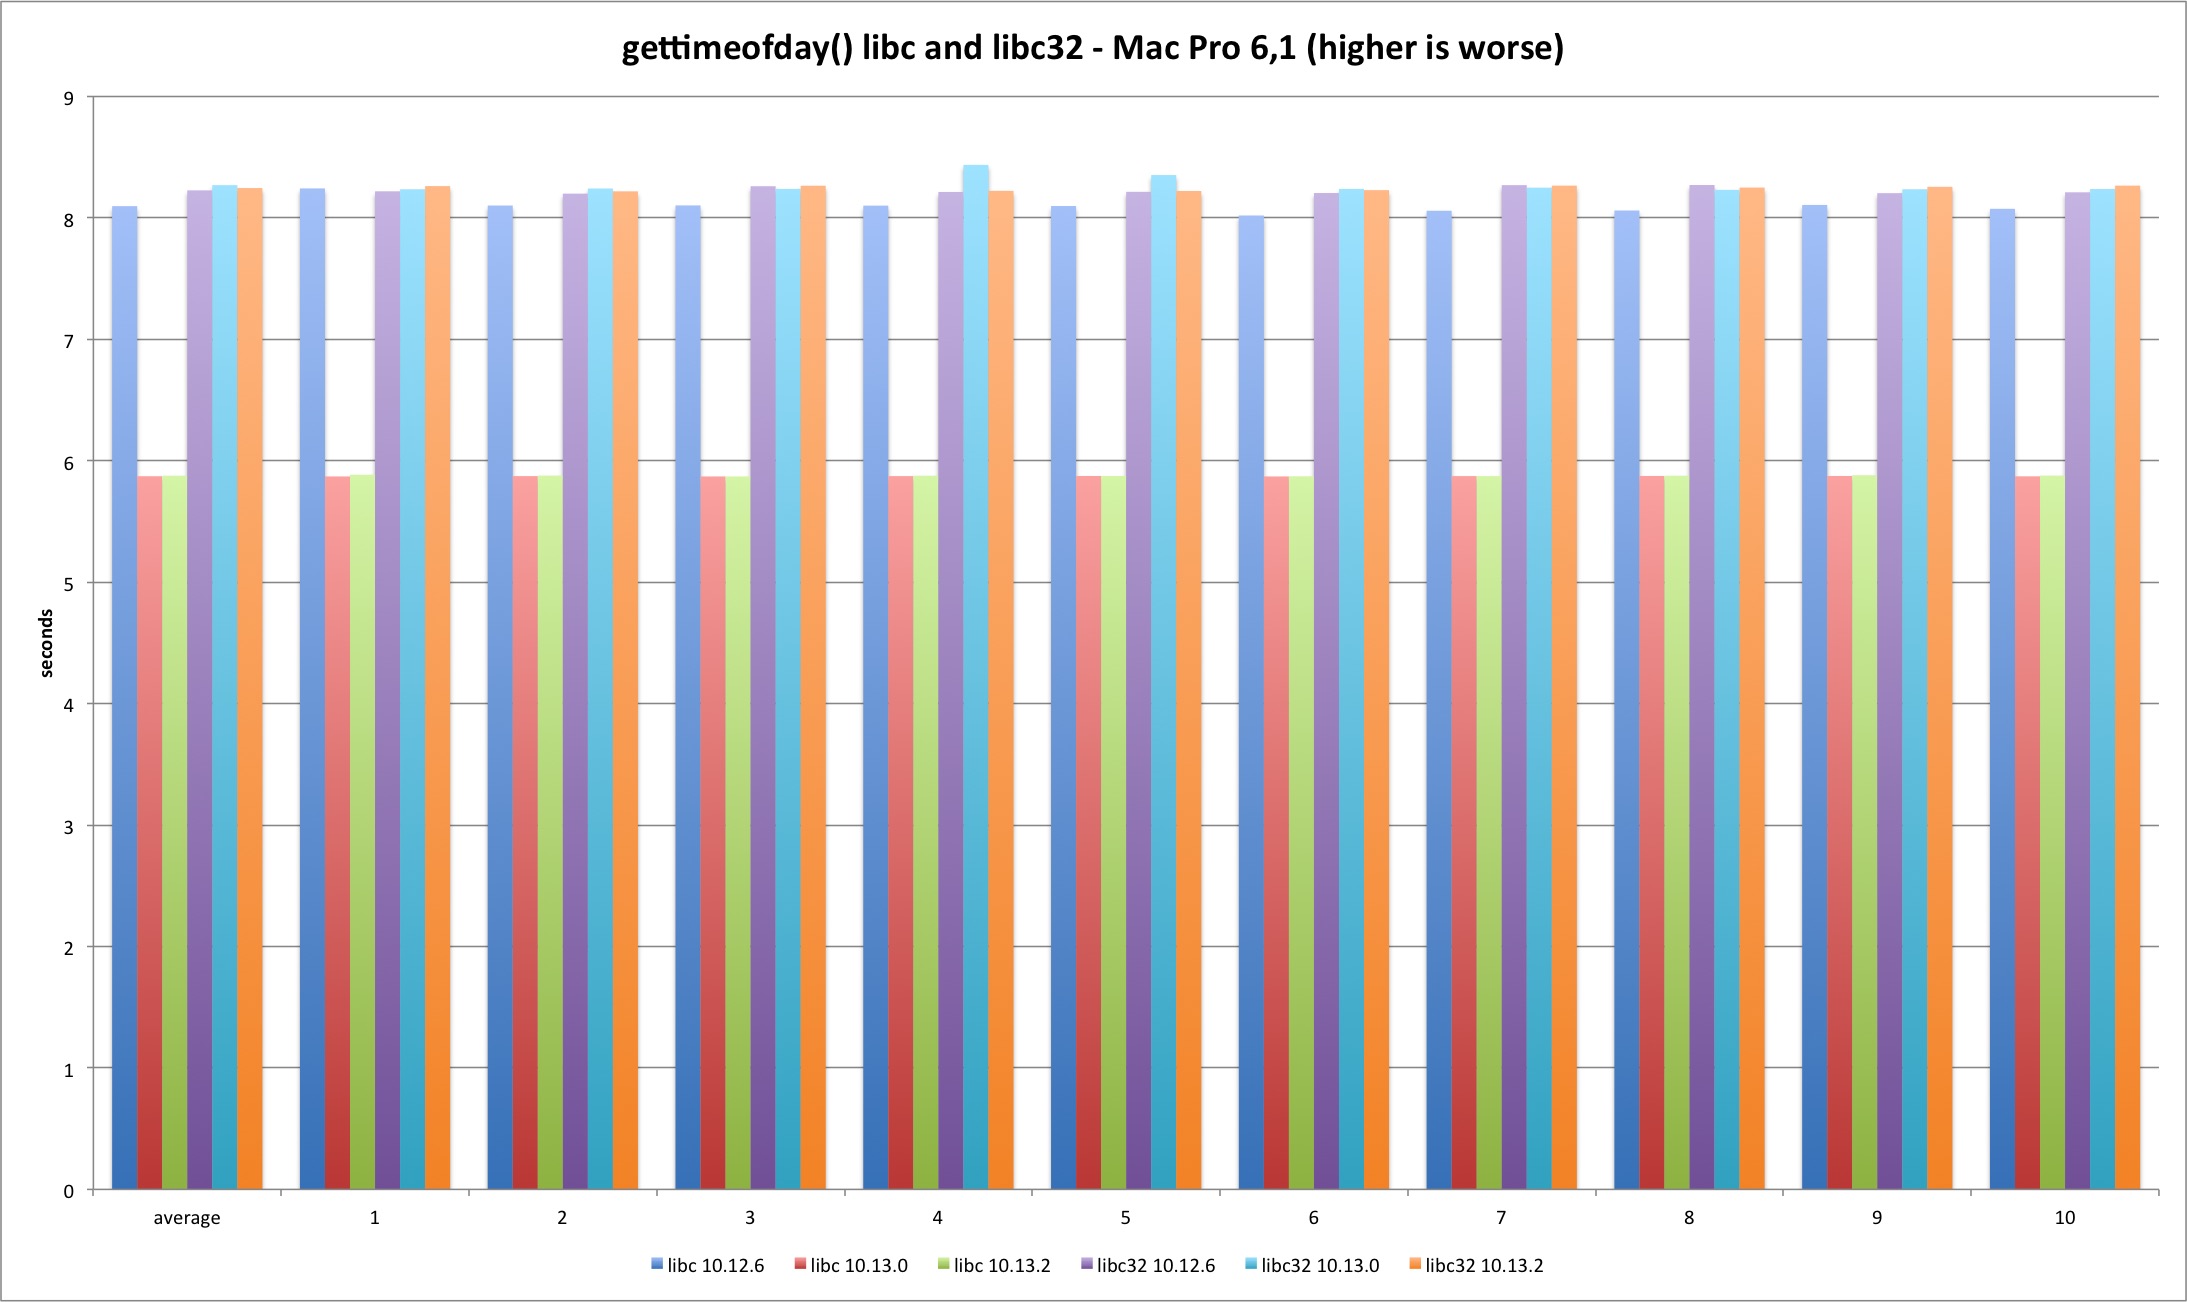
Regarding the syscall, the performance loss holds in both Mac models.
Conclusions
Some of the initial rumours regarding Meltdown discussed the performance impact of the Linux workaround to “truly” isolate the user/kernel boundary. After Meltdown was finally disclosed and it was known that OS X already had a patch released, I got curious about the performance impact and so I tried to benchmark two different Mac models and OS X versions.
The main question to be answered is if the performance impact exists?
Yes, it is very clear.
That leads to a follow up question. Is it relevant?
It depends.
My tests demonstrate that the syscall interface is definitely much slower in High Sierra 10.13.2. This could lead to some drama, that in most cases, is not justified (I witnessed some minor drama because I released an early chart to see what happened). What my tests appear to point to is that some workloads will be slower but they are probably not relevant unless you are doing millions of iterations. Maybe a 10% impact on your build times is not reasonable at all or you don’t even notice it. The most important thing that users and systems administrators need to do is to measure their specific situation. It’s the only way to be sure if this patch is a problem or not, and build their threat case under this new assumption. One thing is sure, this appears to be here to stay in the medium to long term until all hardware is replaced.
Yes it sucks very much that we all lost computing performance due to a CPU bug. Blame all CPU manufacturers and designers. Or you can view this from Adam Smith point of view of “there is no such thing as free lunches”. The computing power increased spectacularly in past decades. Do we really think this was without any trade-offs, in particular security trade-offs? Or maybe those security trade-offs weren’t even known or taken in account?
Because hindsight is 20/20 and now people are finding out old papers (“The Intel 80x86 Processor Architecture: Pitfalls for Secure Systems”) discussing early ideas on this type of problems and others exposing their knowledge and previous experimentations with similar issues (“Finding a CPU Design Bug in the Xbox 360”). So the ignorance defence is probably harder to sustain and it was just a trade-off performance vs security. Money talks, security walks ;-).
Cheers to all the researchers involved in Meltdown and Spectre, this was top notch security research.
If you detect mistakes or significant differences in other models please let me know. I expect the results to hold with other models so I am curious about it.
Have fun,
fG!