A few weeks ago, Copycat sent me an email asking if I knew anything about the TNT warez group macOS cracks. They were worried that the cracks could be used to leverage malware since TNT is (?) Russia based. Cyber war is real and this could be an interesting case to look at.
These cracks are based on a dynamic library injection, with obfuscated code and anti-debugging measures. This of course triggered my curiosity since the usual anti-anti-debugging measures (ptrace & friends) weren’t working. Even more interesting, one of the cracked apps had pro-Ukraine related content that was modified, so it was a perfect target for malware. Even if malware free, what was behind the obfuscation and anti-debugging?
One of the long standing myths from the warez scene is that it is malware free. While it might be true at the source (aka scene releases into the closed FTPs or whatever is used now), the reach of warez these days is quite large, and like the telephone game, the incentives are strong for “corruption” on each distribution step. Incentives are always one of the best tools to try to understand what might happen in a given situation.
It’s also not uncommon for warez groups to protect their cracks. Most apps use the same protection code between versions, so if you break the cracks then you can race the original group to release on the next app version and easily earn scene cred. Imagine a AI bot racing other groups :P.
Given these facts, it was time to poke around and try to understand what was going on, in particular the anti-debugging issues because I like them.
There are x86_64 and ARM64 versions, and they have different features. The x86_64 version is more “complex” because it is the older platform and allows for more tricks, while ARM64 is a bit harder to play the same games, which is in favor of the reverse engineer.
The x86_64 version is obfuscated/encrypted/packed/whatever, while the ARM64 version isn’t. Both have very similar code in nature, so most probably the TNT tool code is the same for both versions, with less features for ARM64 platform.
We shall explain and observe the differences soon.
Most writings and presentations about reverse engineering are rewritten history (at least mine are!). They look linear but the real work behind them is many times chaotic and random, especially against new targets. For example, I noticed or discovered a few more details while writing all this. Writing and trying to explain things to others is always a great self-learning and discovery exercise. It’s also an opportunity to try to improve methods and techniques so we can improve next time. There is process but also art so many different approaches to a target are possible. Always Be Learning.
I wrote a few tools to assist this work. One is C4, a code analyser and strings dumper based on IDA’s CTREE API and the new idalib feature (much better than doing plugins the old way, and crazy fast!). Another is semtex, a Unicorn Engine based tool to dump the x86_64 binary and fix some of the obfuscated information. As I was writing this post, I also created sx4, a fully static alternative to semtex.
These names might have not been the best idea in these keyword searching modern times but couldn’t resist :-]. The source code for semtex and sx4 are available while C4 will stay private for the time being.
I’ve also developed two IDA plugins: navcolor, which colorizes functions in IDA navbar, making it easier to visualize possible important functions or code characteristics; and iFold, which automates IDA’s pseudocode folding (more on this later).
I’m going to merge all my plugins into a single one to avoid scattering C/C++ plugins.
Screenshots use the default IDA themes and the amazing TheSansMono Condensed SemiLight font. My irreplaceable and favorite font for work (IDA, development, terminal, etc). I have tried many others, none is this amazing!
The target applications
The main target application is Downie version 4.9.7 and is Intel only. Other cracks targetting Apple Silicon and Intel CPUs were used to compare their implementations and features.
The dynamic libraries used in this post belong to Downie v4.9.7 (x86_64) and Lyn v2.1.2 (x86_64/ARM64):
- libC.dylib SHA2:23dbea802551318a81d900654bd5bd3365a48f8a9053880ecabc1244898e1147
- libConfigurer64.dylib SHA2:4de75b0ab14402ba3a8bb1c4d406fbfc628f3855c4a12e76e3fb186554af1315
The injected dynamic library is named libC.dylib or libConfigurer64.dylib (as far as I have seen in all the samples I collected) and frequently located in the Resources folder.
I was going to make those files available but that might be a bad idea given that they are fully functional cracks and not looking for possible DMCA issues. They are easy to find anyway 🏴☠️.
Initial reconnaissance
Initially, I loaded the x86_64 version into IDA. It was clear that the code was obfuscated (or/and encrypted/packed/virtualized/etc) due to the amount of unknown and garbled instructions. The variable instruction length of x86_64 code makes many of these tricks possible versus the fixed instruction length of ARM64, which makes impossible those tricks. Life is much easier in ARM64 and I enjoy it more each day.
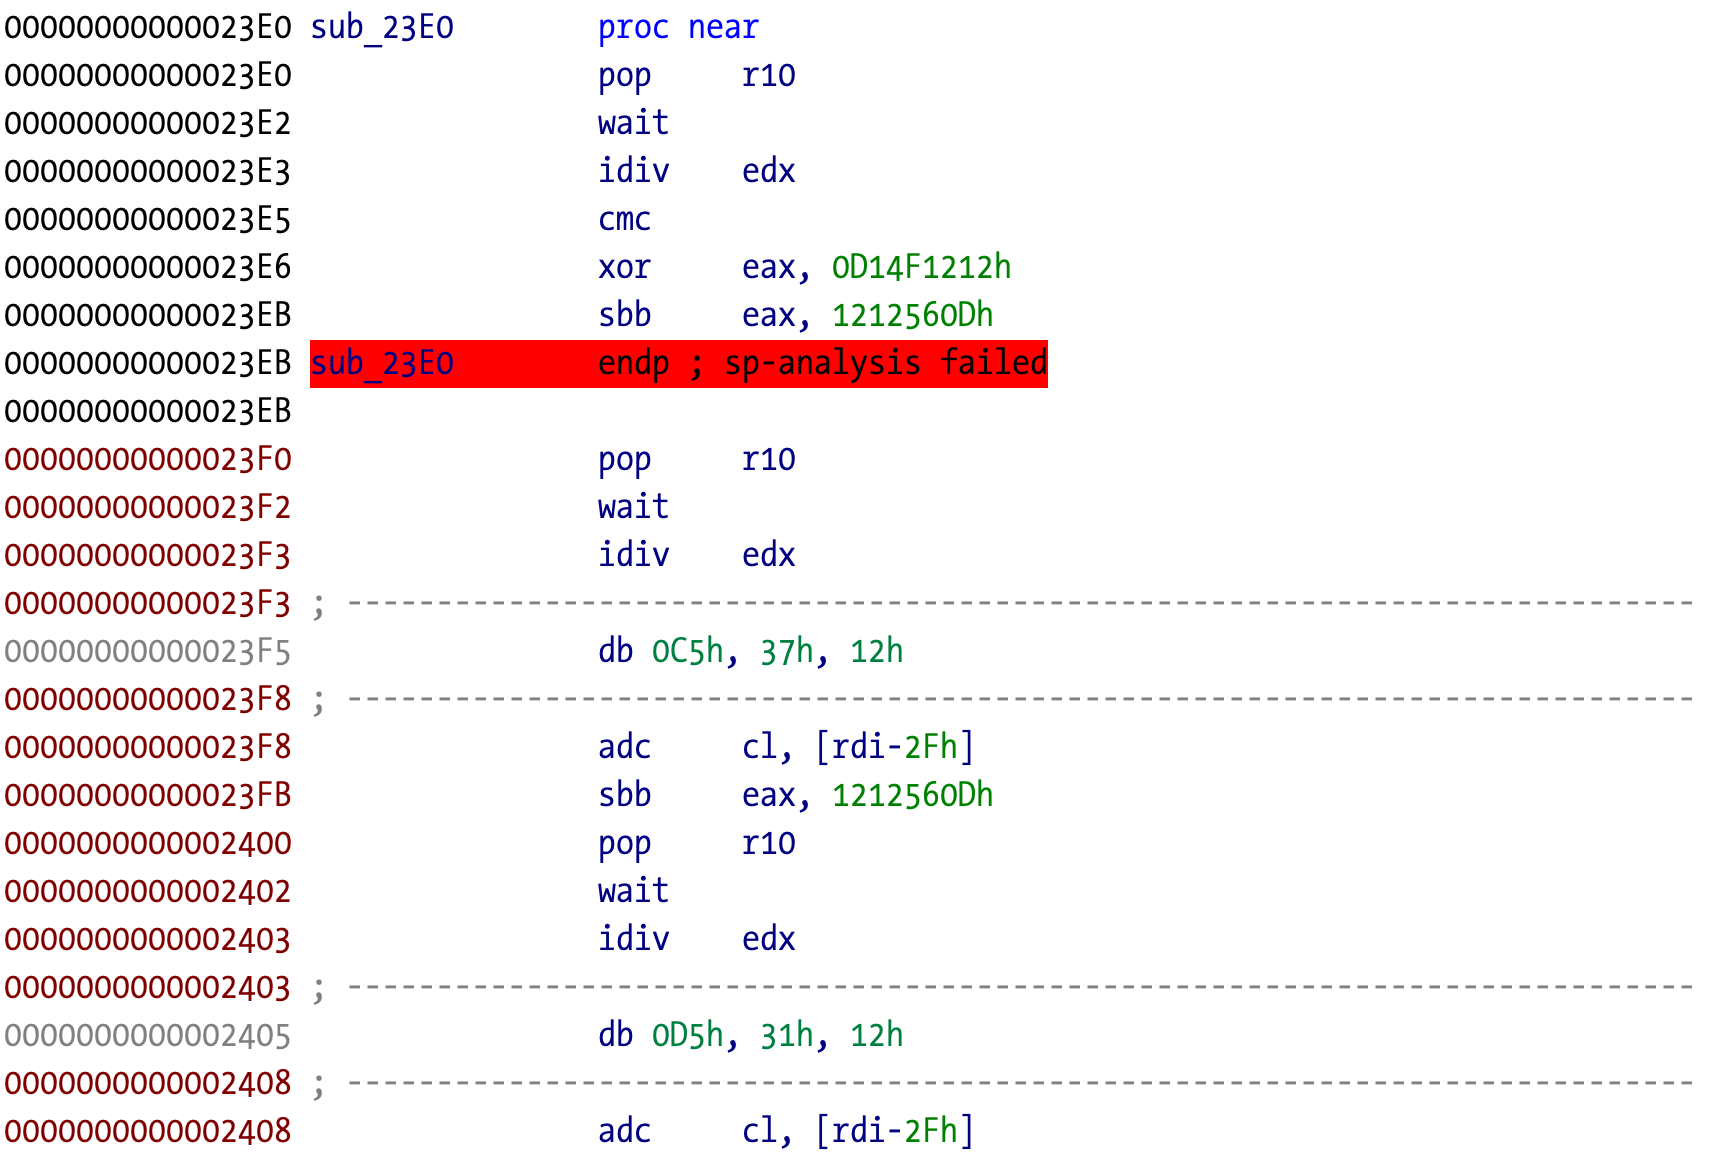
IDA’s navigation bar shows that disassembly has largely failed, with very few auto-identified functions. A clear sign of bad things waiting for us, the adventurous reverser engineers.

Given these target characteristics where do we start? What is the entrypoint of this code?
Dynamic libraries are just a group of functions that can be called by other code, applications or other libraries and frameworks. They don’t have an entrypoint where executing starts such as main in executables. Except if they have constructors and/or load methods. These particular “functions” are executed when the library is linked into the target memory space. They aren’t exclusive of dynamic libraries and executables can also have them. Because the code is obfuscated something must be happening before it is usable by any external caller, so constructors and/or load methods are our starting point.
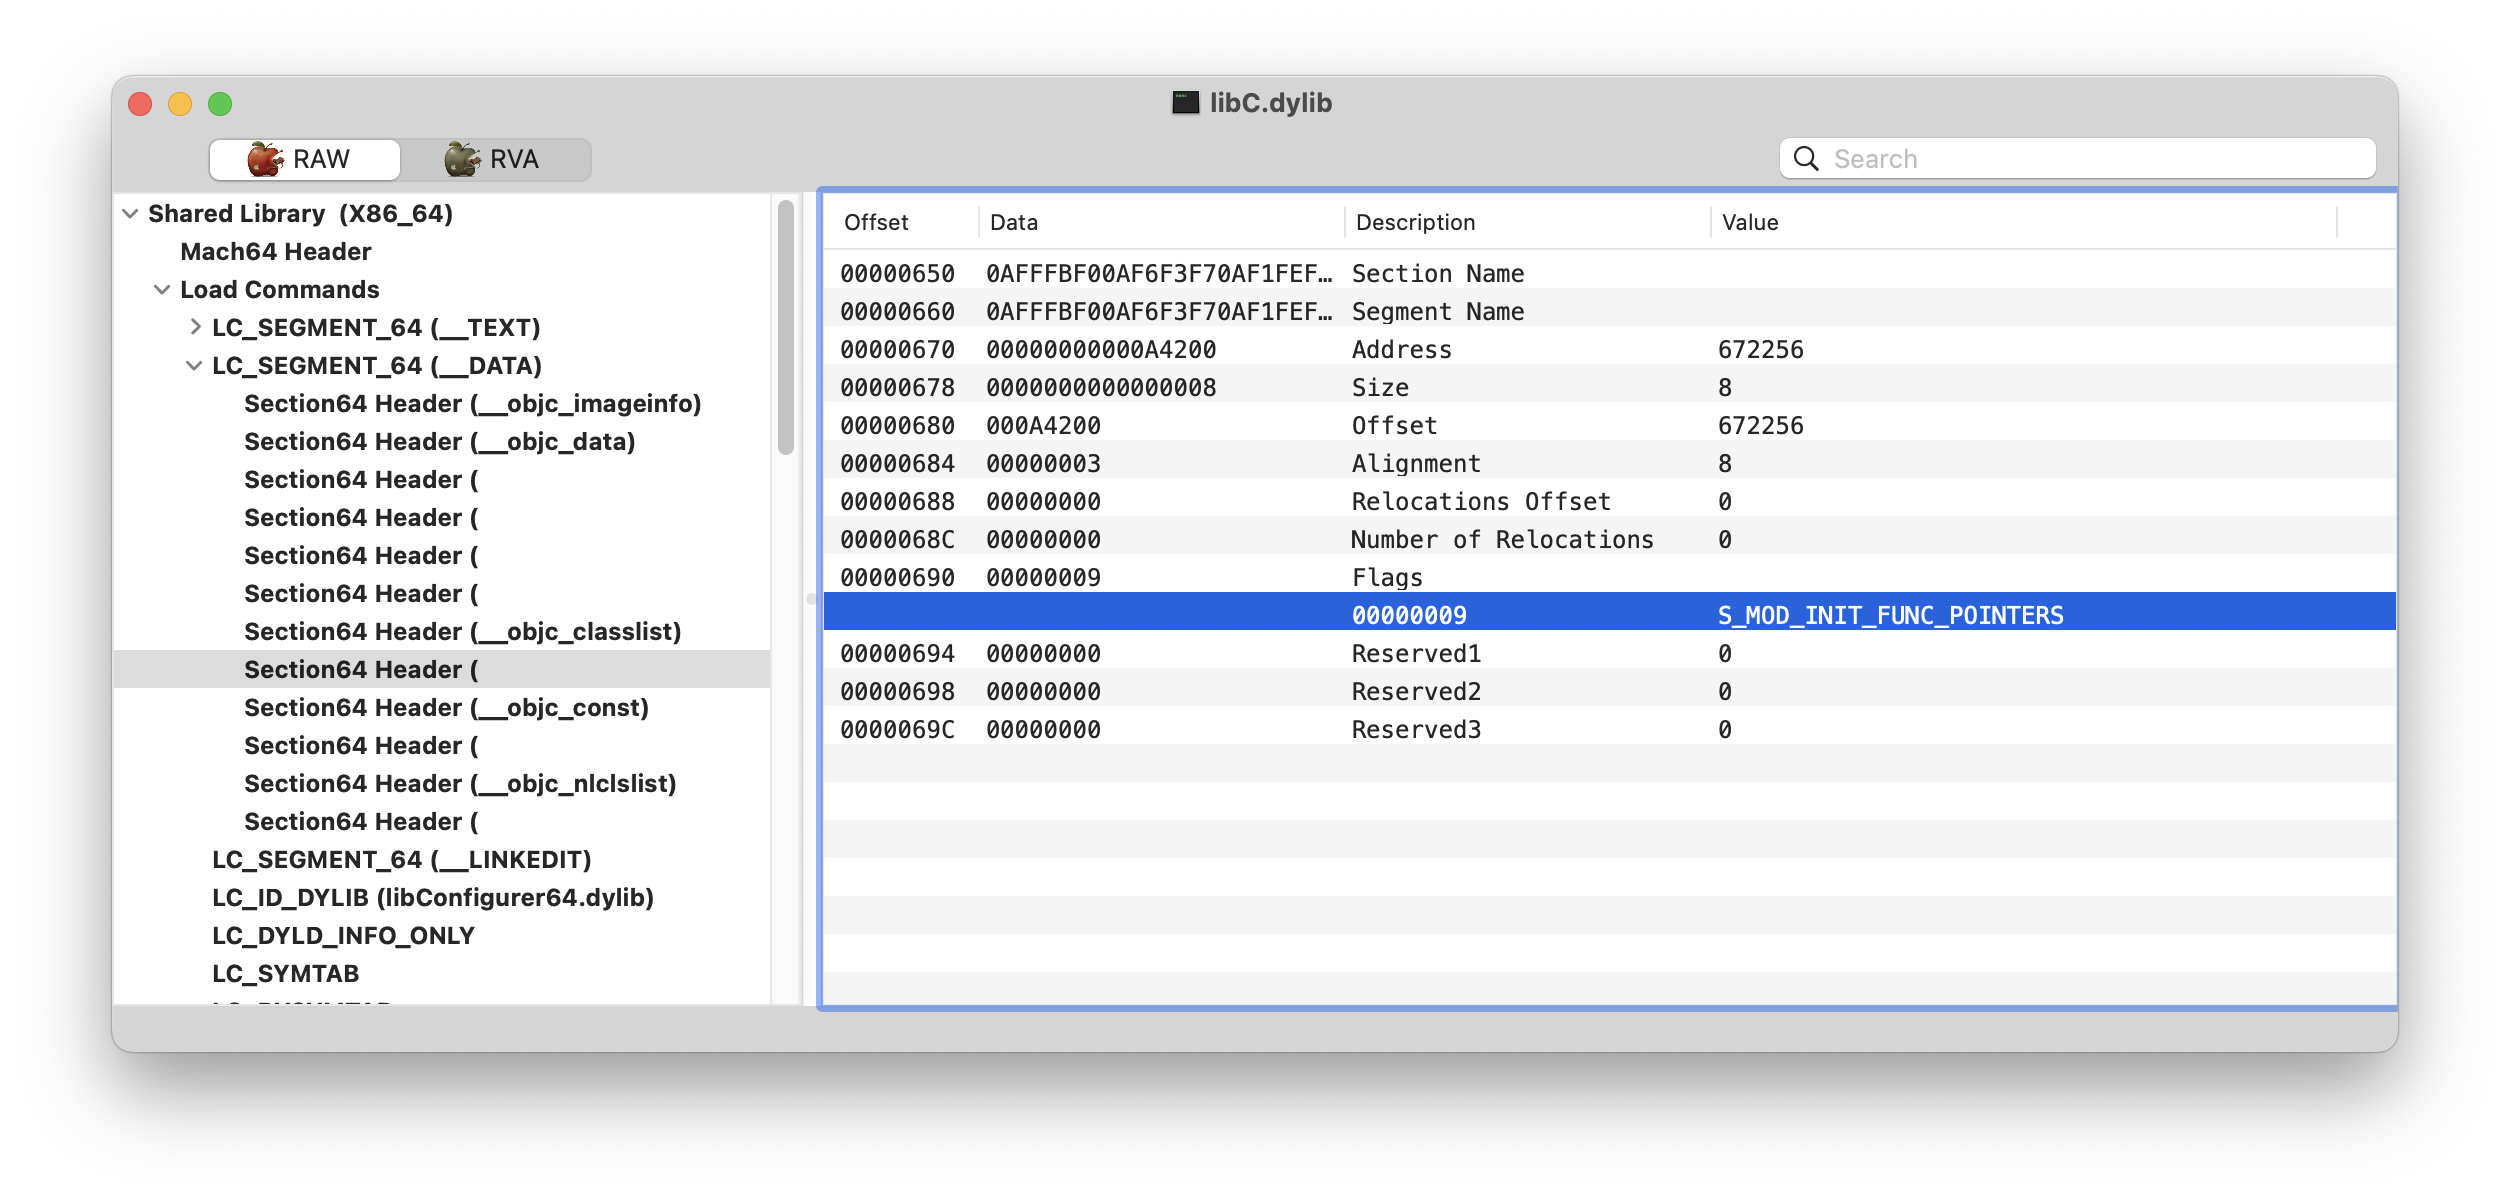
The constructors are usually found in the __mod_init_func section. It’s essentially a table of pointers to functions that will be executed in the linking stage. Since this section name can be obfuscated we can identify this section using the flag S_MOD_INIT_FUNC_POINTERS. Destructors are called when the application terminates and can be usually found in __mod_term_func, and the section flag is S_MOD_TERM_FUNC_POINTERS.

In this case the constructor partially disassembles to junk code. This is certainly not executed before something else happens. The load method is another candidate when Objective-C is involved. These methods execute before constructors so there is a good chance they are fixing the obfuscated code.
We want to locate any class load method(s). According to the Objective-C language they are defined as +[className load]. In this particular case, IDA is unable to identify any method. One possible reason for this is that the Mach-O headers have been mangled (such as section names removed, symbols named to random garbage) to further obfuscate the binary and make reverse engineering a bit more annoying.
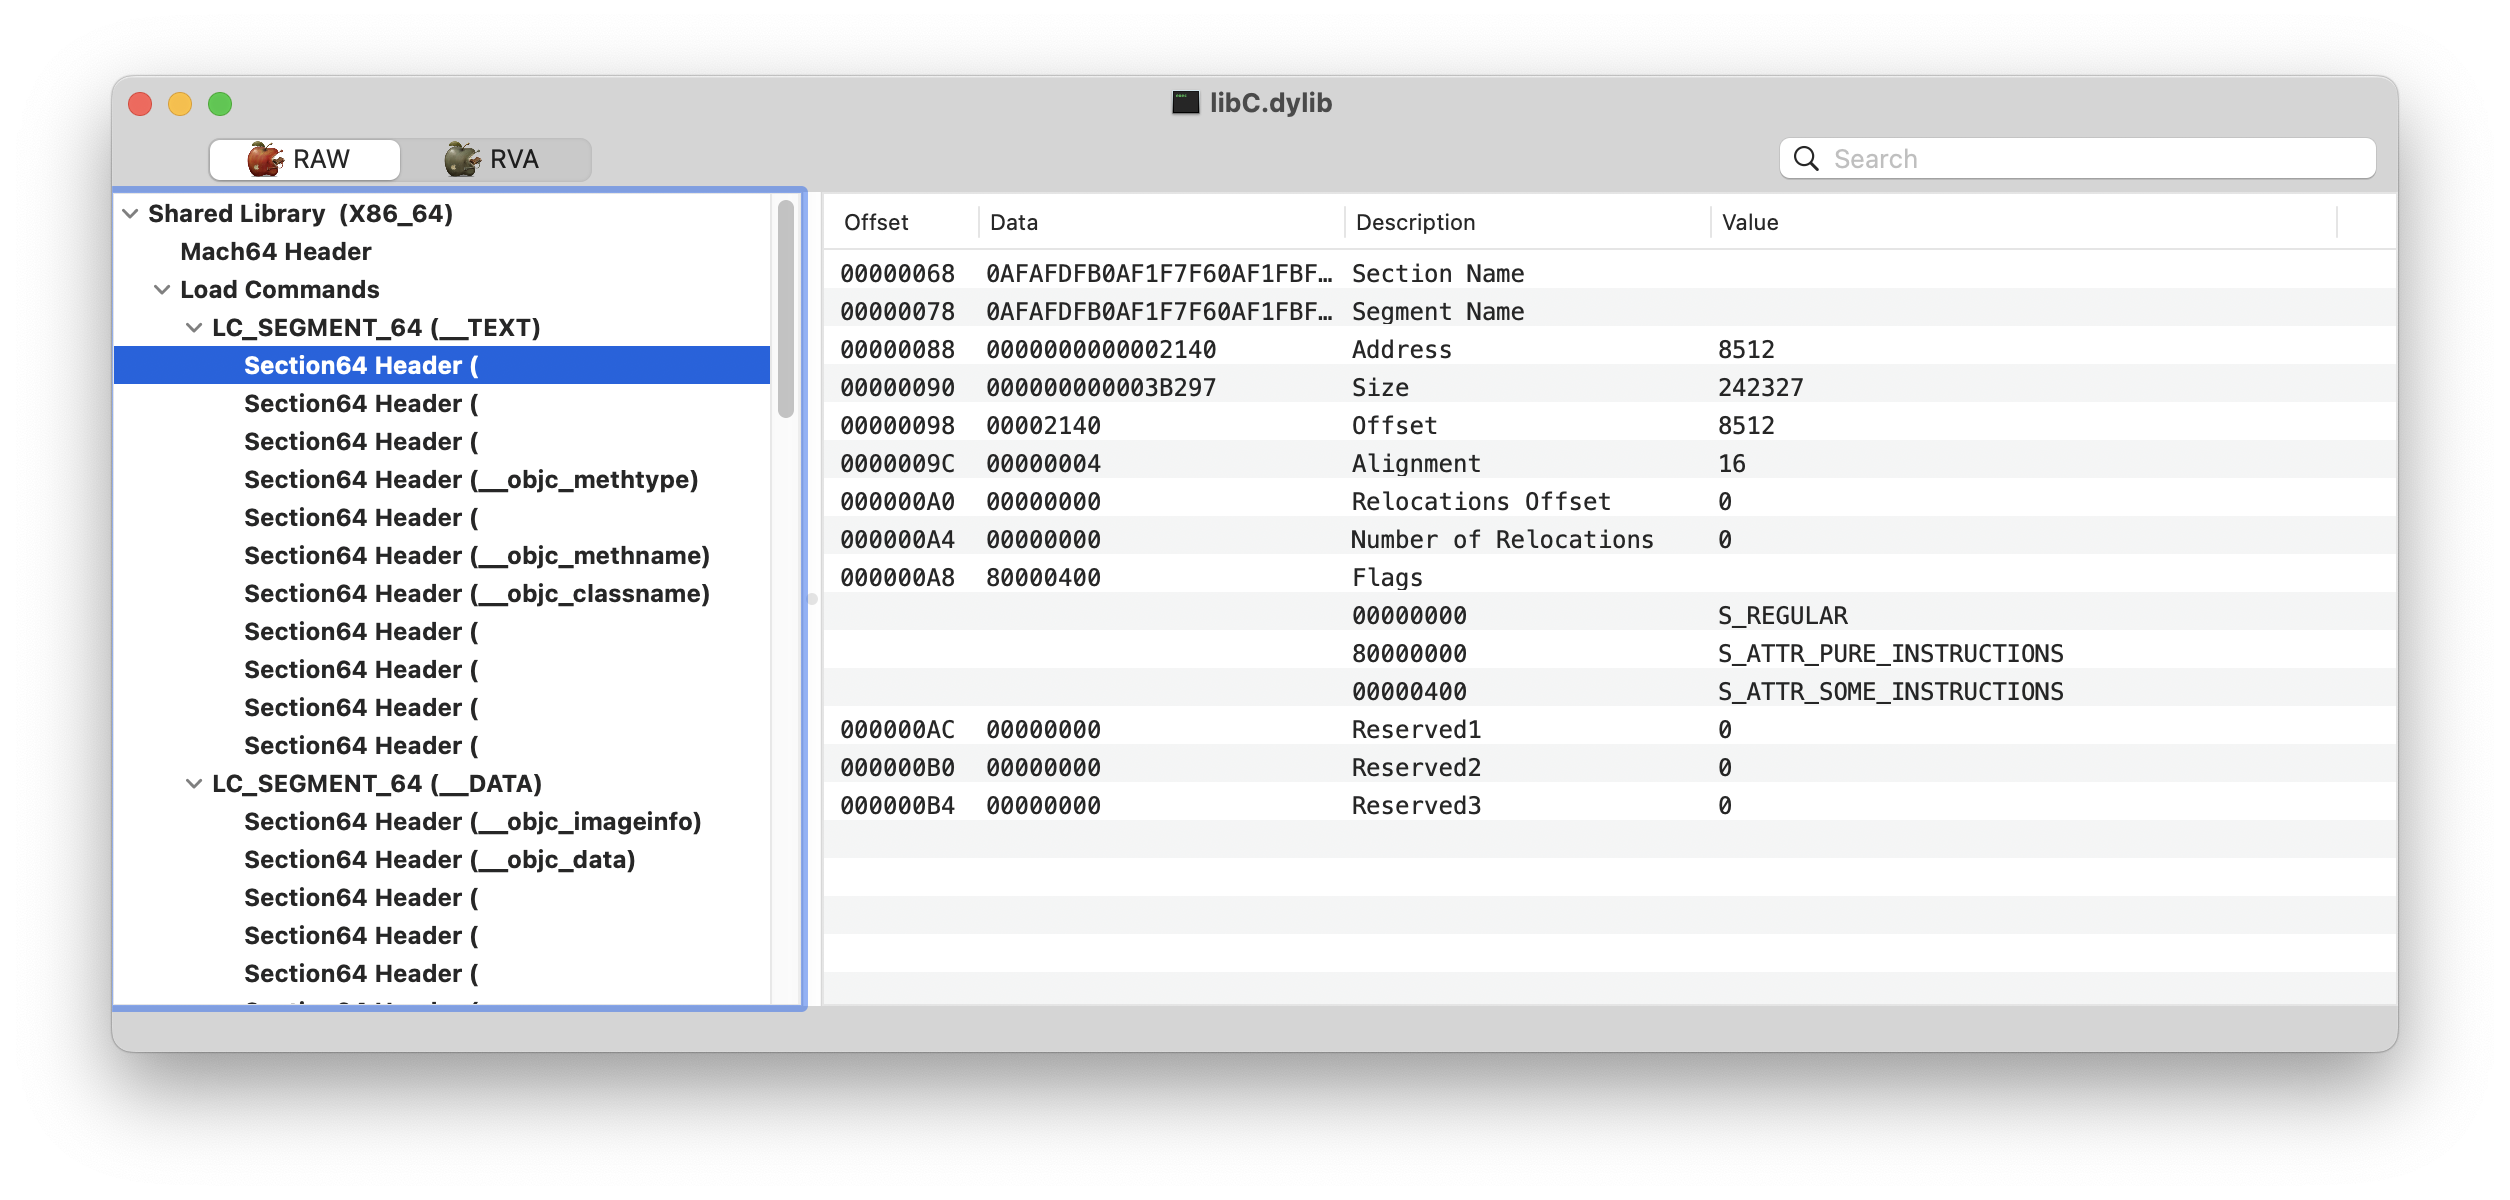
Luckly for us, Objective-C is a bit harder to obfuscate and hide due to requirements from the runtime. That’s the reason why all the Objective-C sections kept their original names.
While IDA is unable to recognize any load method, we can explore the sections and manually locate them. We don’t even need to know anything about Objective-C internals to achieve this. Just explore each __objc section and see if there are any potential pointers or references to code locations.
The __objc_const section contains all the information we need. We can see the method name, its signature v16@0:8, and what appears to be a pointer to the address 0x17D2B.
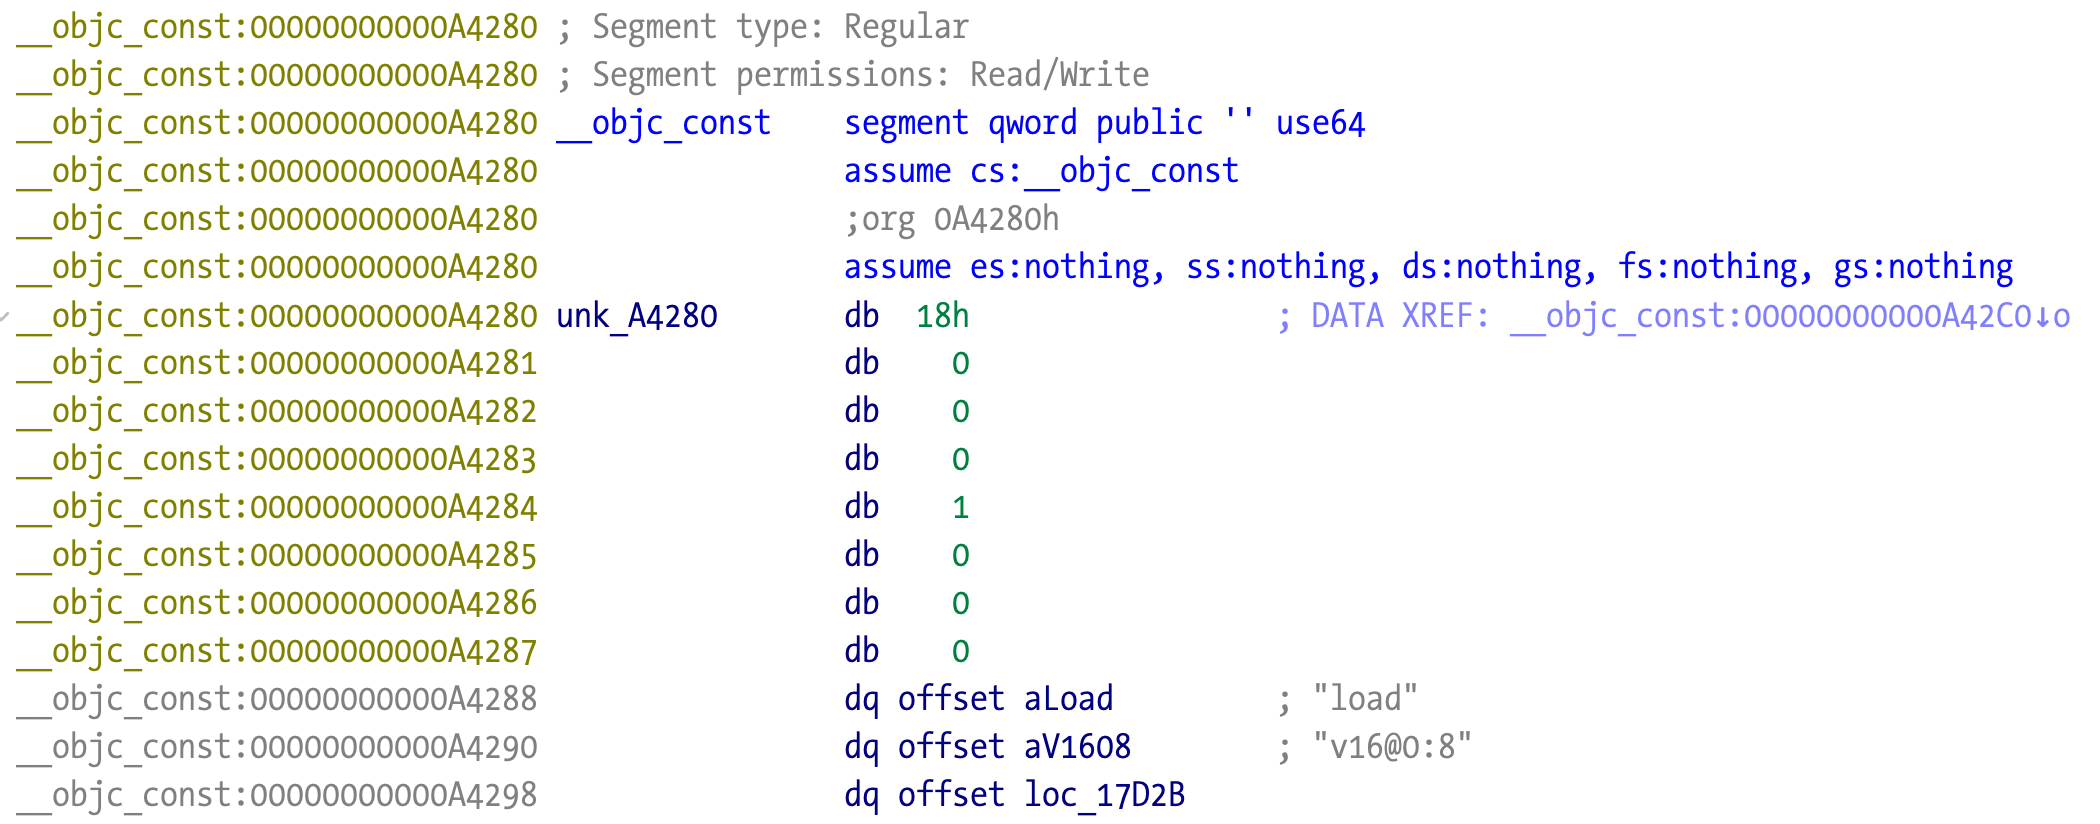
It points to a code address, and if we go there we can observe that IDA was unable to make a function. But it looks like a possible function, with the usual prologue code (push rbp, etc).
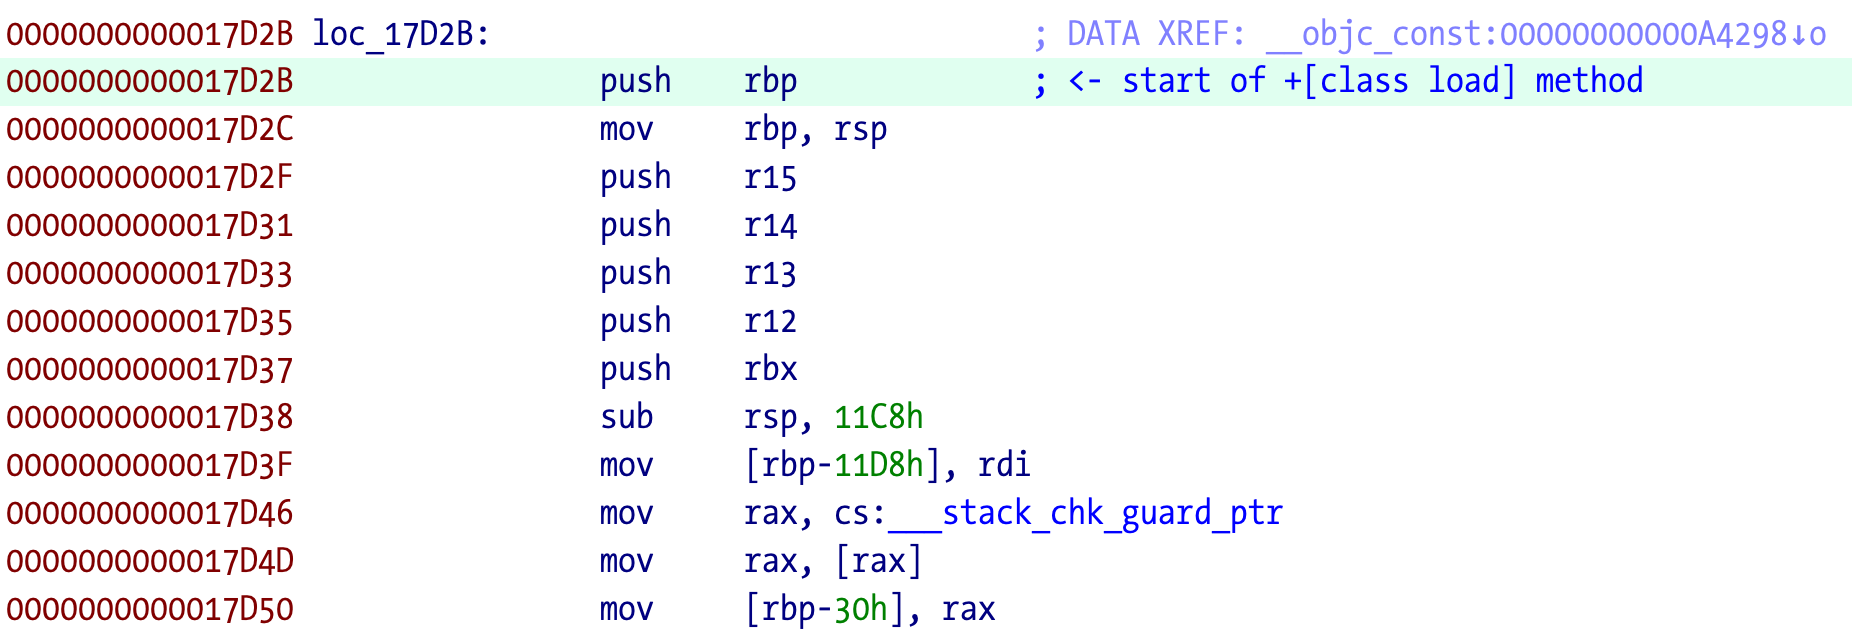
If we try to make a function out of it, IDA complains about unrecognized code, so something is bad somewhere in the code. IDA can’t label the method(s) because the addresses it can find aren’t valid functions so its algorithms are unable to proceed. That is a problem to deal with later on.
________________:000000000001A677: The function has undefined instruction/data at the specified address.
Your request has been put in the autoanalysis queue.
Looking at the same section in the other sample:
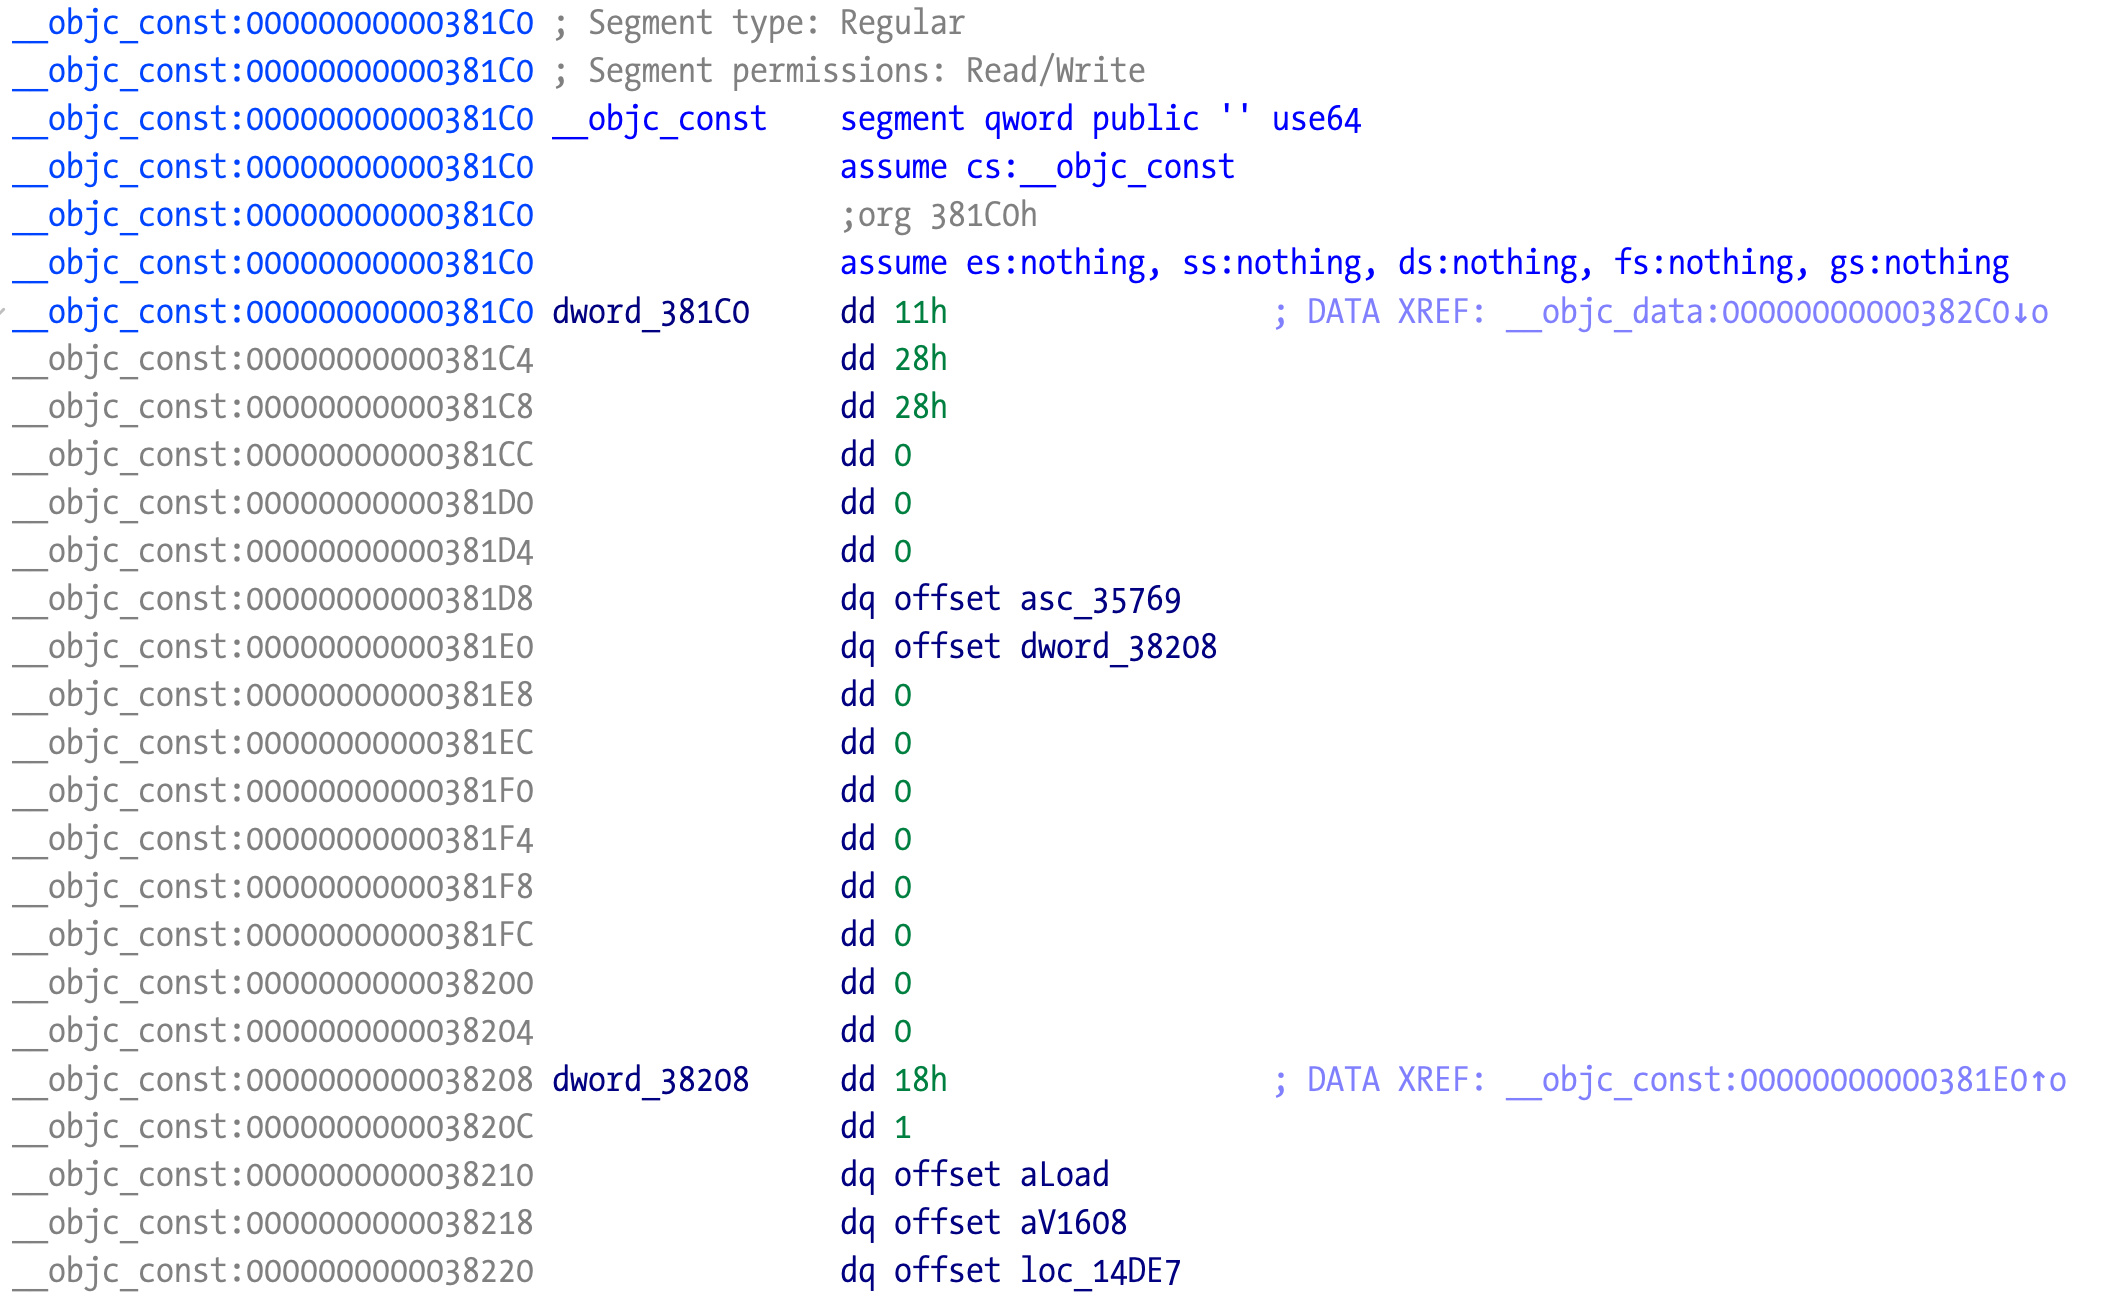
The information is still there, the layout of the __objc_const section is slightly different. They are all Objective-C structures that we can use to automatically locate the load method. This is what semtex does to find the methods. Have a look at macho.c source code to understand how.
=> Locating the load method...
[DEBUG] Read-only class info at 0xa42a0
[DEBUG] Methods array @ 0xa4280
load method implementation @ 0x17d2b
It is now clear that we want to debug and reverse this method since there is a strong probability that it will be responsible for fixing the junk code all over the binary. An easy and quick way to test this theory is to just modify the library and the first instruction on this method to a INT3 or BRK #0. The debugger will be triggered or the app will crash if there is no debugger attached, a sign that the method is being executed.
A quick glance to the imported symbols allows us to have an hint that Objective-C method swizzling might be used to implement the cracks. Too many apps out there are just protected by a isRegistered method 💀💀💀.
We are interested in imports such as:
- class_getClassMethod
- class_getInstanceMethod
- method_getImplementation
- method_setImplementation
- method_exchangeImplementations
The symbol information from LC_SYMTAB is obfuscated:
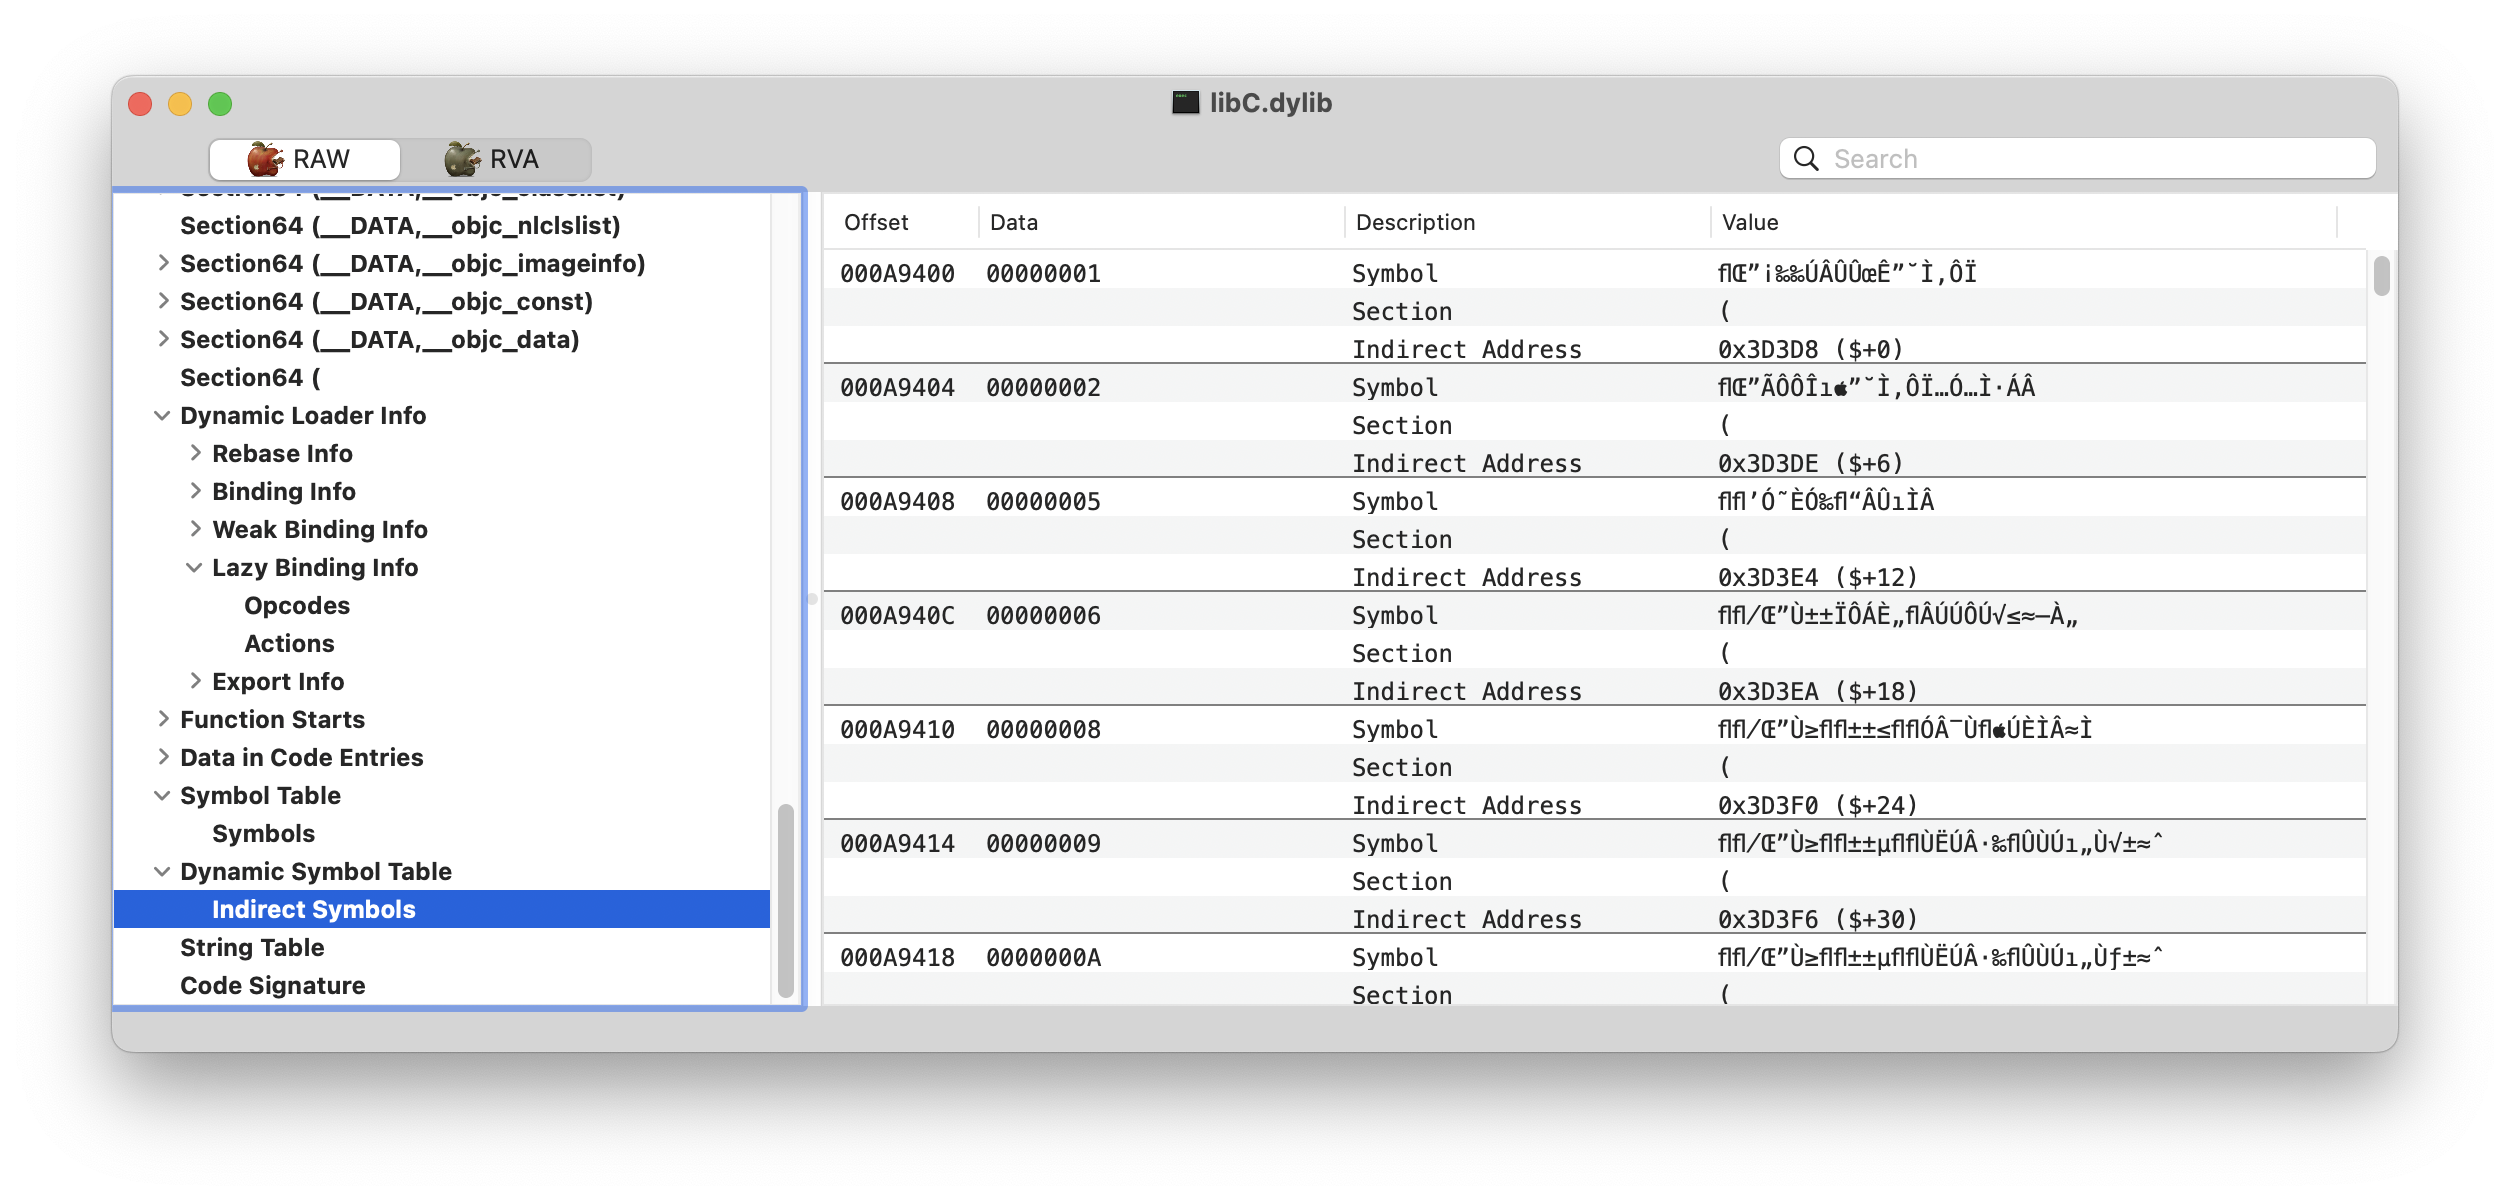
But that information must be somewhere otherwise the linker wouldn’t be able to deal with this binary. In this case it’s in the LC_DYLD_INFO_ONLY segment, the one that a modern dyld preferentially uses.
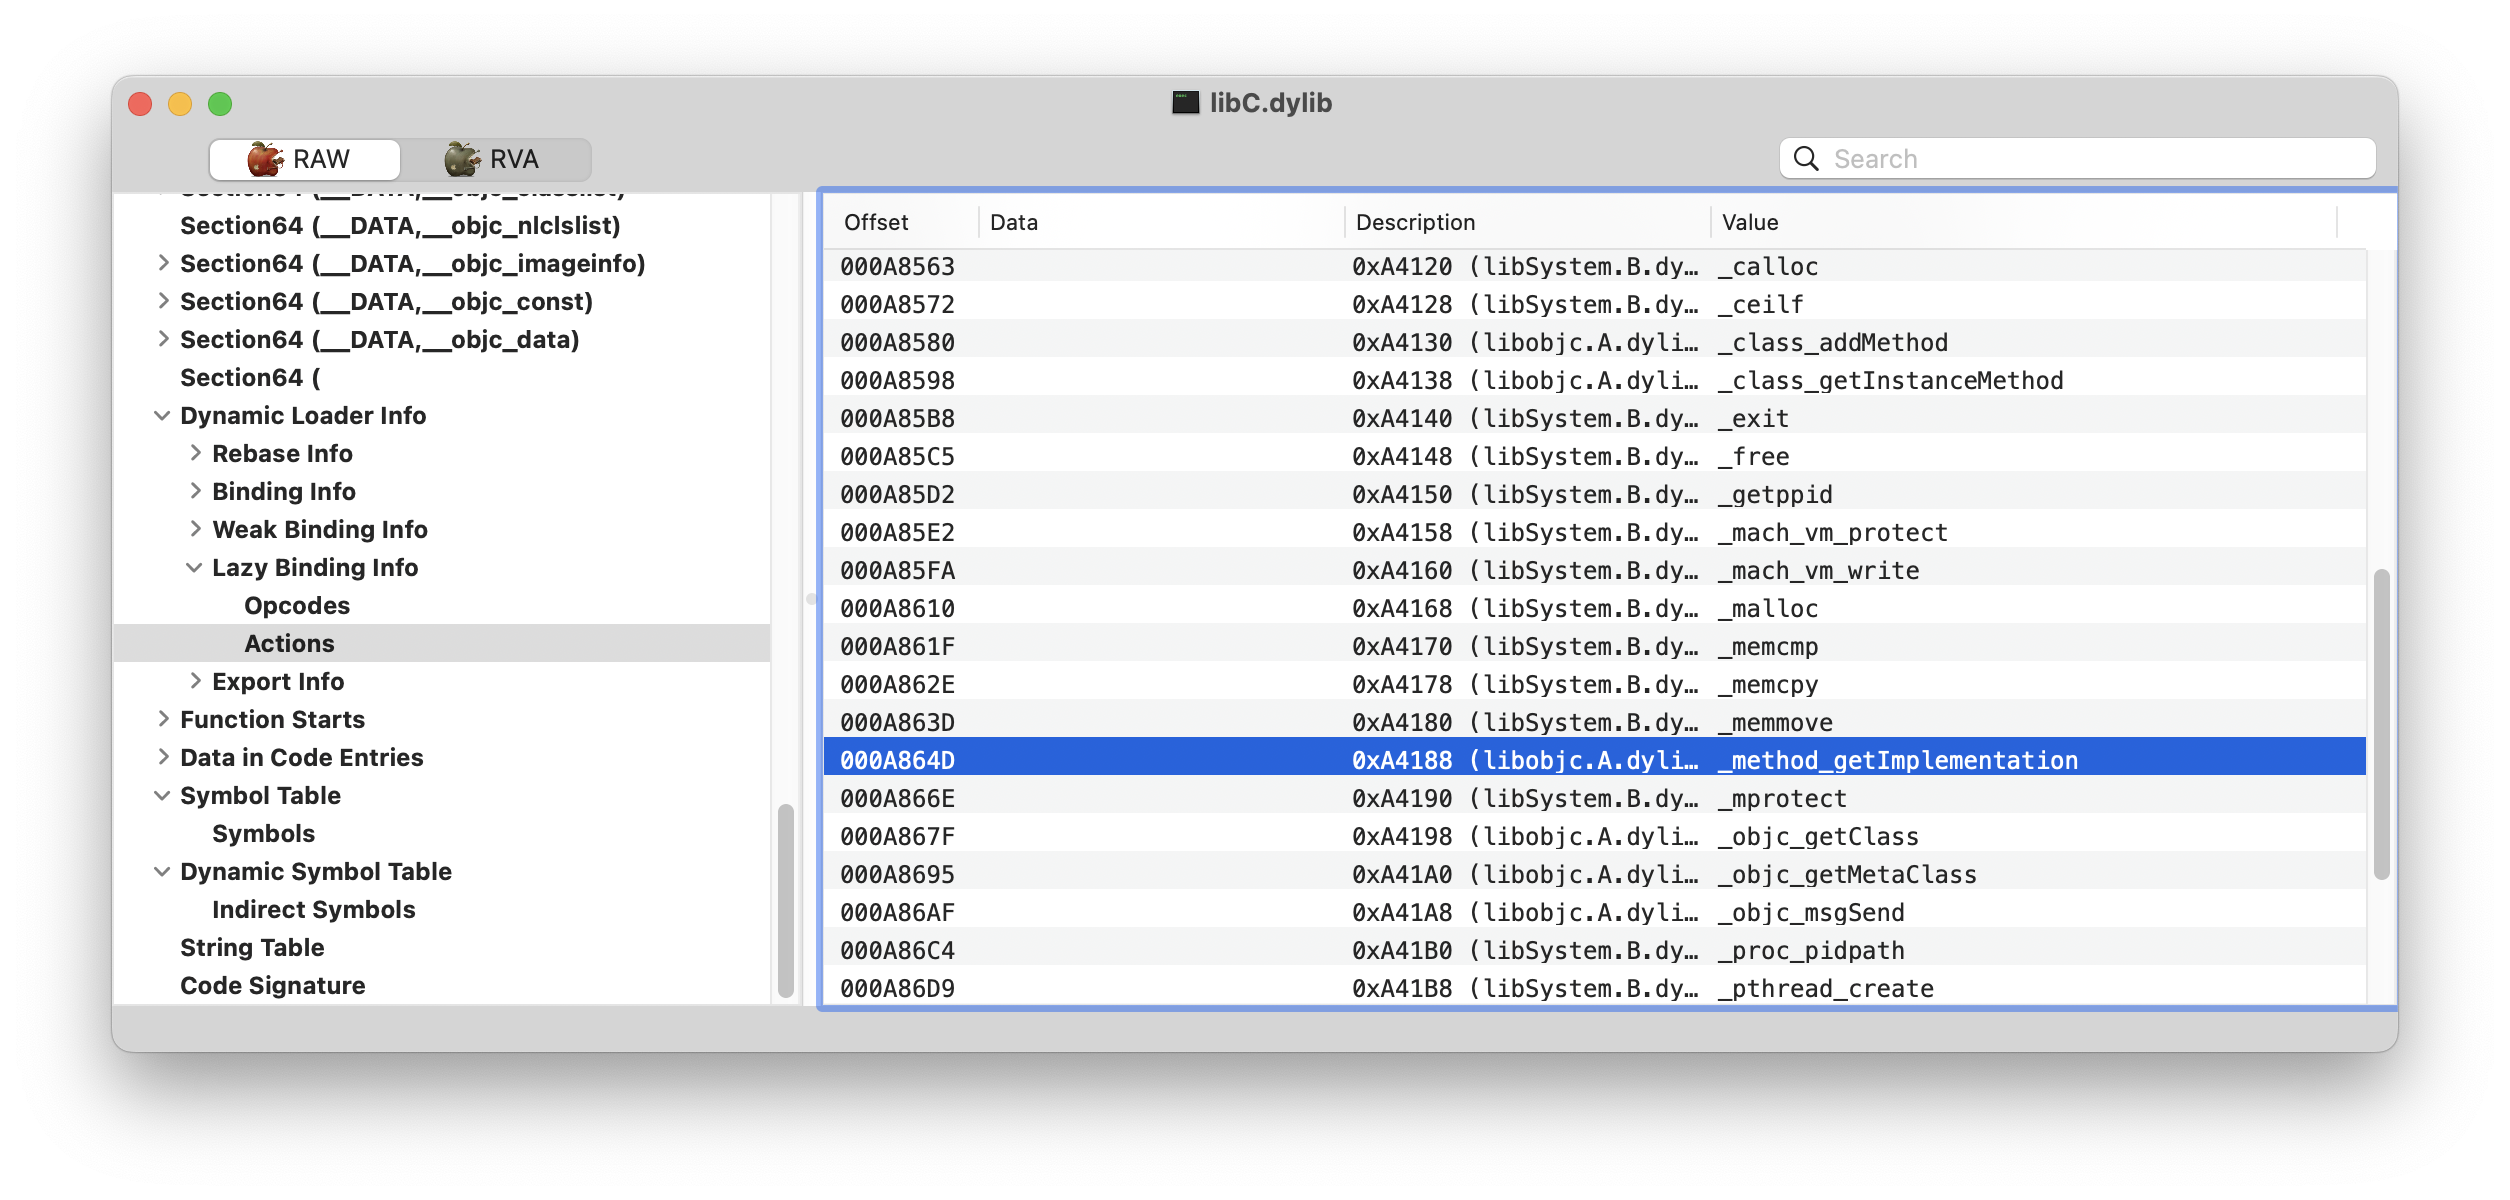
Funny enough, Apple tools don’t like the binary:
% objdump --macho --lazy-bind libC.dylib
libC.dylib:

Lazy bind table:
segment  section            address     dylib            symbol

???
???
???
???
???
???
???
???   0x0003D430 libSystem        _NSAddressOfSymbol
(...)
???   0x0003D508 libobjc          _class_addMethod
/Applications/Xcode16.2.app/Contents/Developer/Toolchains/XcodeDefault.xctoolchain/usr/bin/objdump: error:
 'libC.dylib': truncated or malformed object (for BIND_OPCODE_SET_SEGMENT_AND_OFFSET_ULEB bad offset,
 	extends beyond section boundary for opcode at: 0x2b0)
At this point we can conclude that the binary is obfuscated and that we want to reverse and debug the class load method as our starting point to understand the deobfuscation process.
The ARM64 binary
After verifying that x86_64 binaries are obfuscated I started working on the ARM64 version instead. Since Downie is x64 only, the target for this section will be Lyn using libConfigurer64.dylib.
As I wrote before, the ARM64 binaries aren’t obfuscated. IDA is able to produce an apparently clean disassembly, and that’s a good sign.

The Mach-O headers aren’t mangled either, and IDA identified the load method.
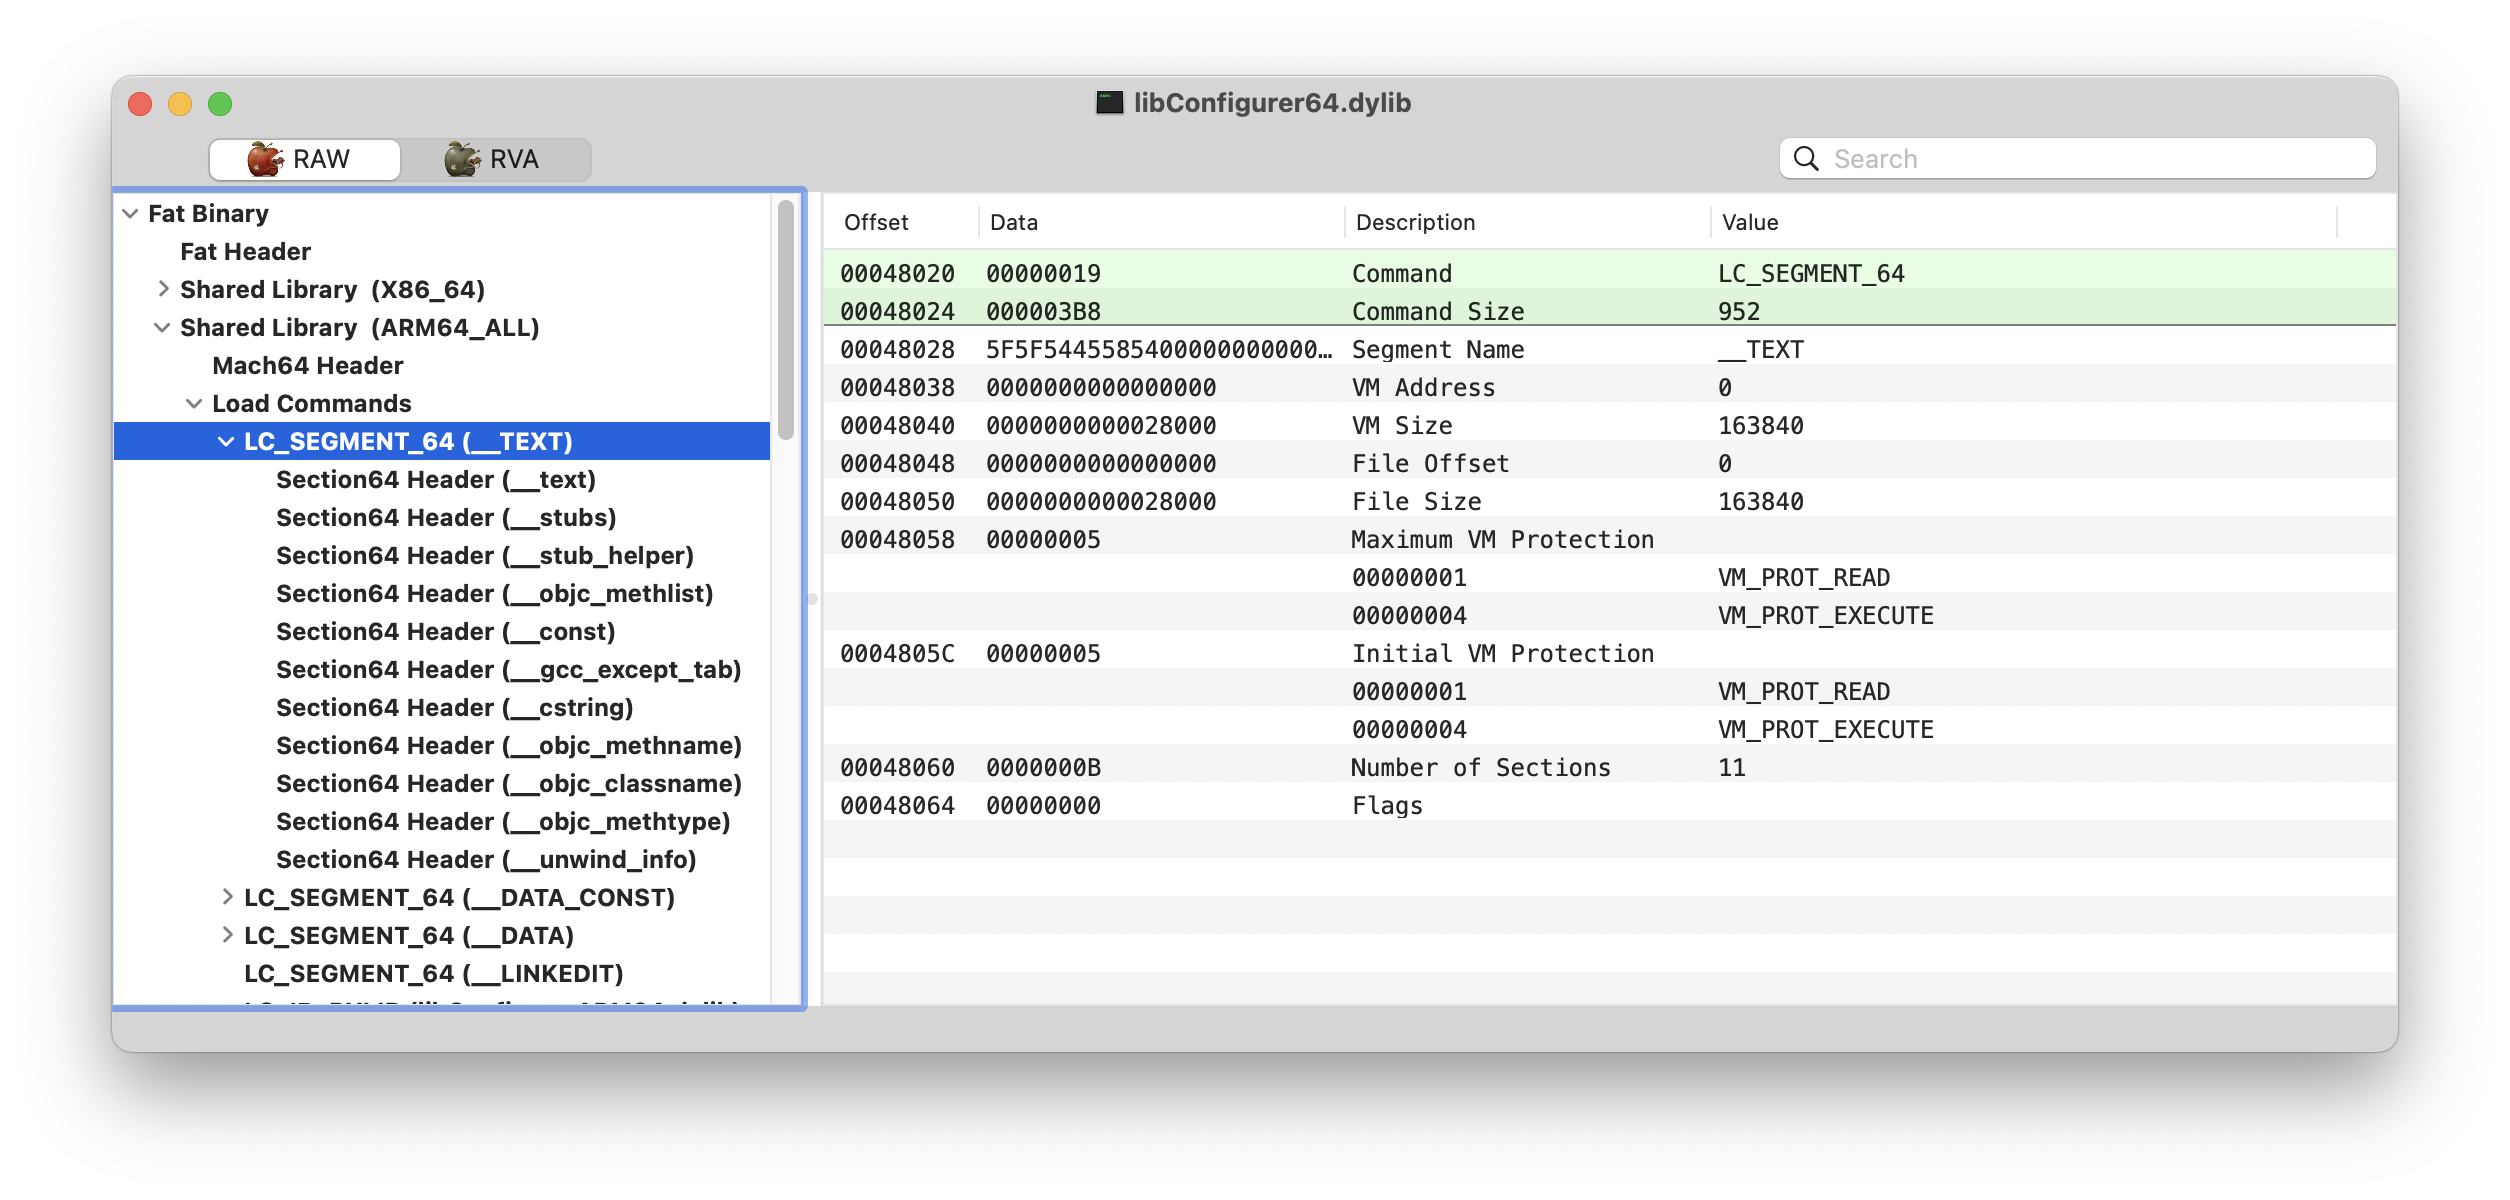

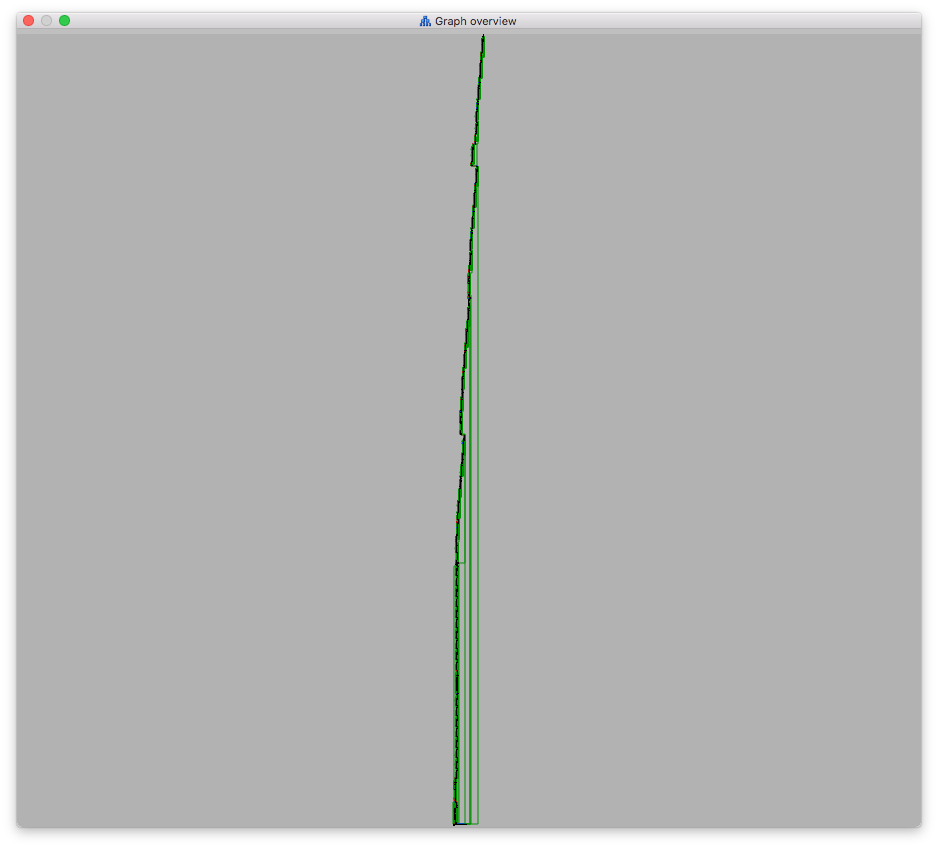
The code isn’t garbage code as the x86_64 version but if we look at its graph it also doesn’t look normal. It resembles a graph of flattened control flow or contains a large amount of sequential useless code, making the method difficult and/or tedious to reverse.
We can also notice how big this method (in red) is relative to the rest of the code. The navbar color change for the function was done using navcolor IDA plugin. It allows to color functions in the navbar and it’s super useful to quickly identify functions like this. I added features such as color the N largest functions to visualize what is going on.

How do you deal with this type of target? It’s a matter of personal preference and experience. Personally I’m a fan of starting with an overview and feeling the code (à la +ORC zen cracking) before diving into the details and possibly get lost in irrelevant code. Browsing around allows you to sense what appears to be repeated operations over and over. Something like this:
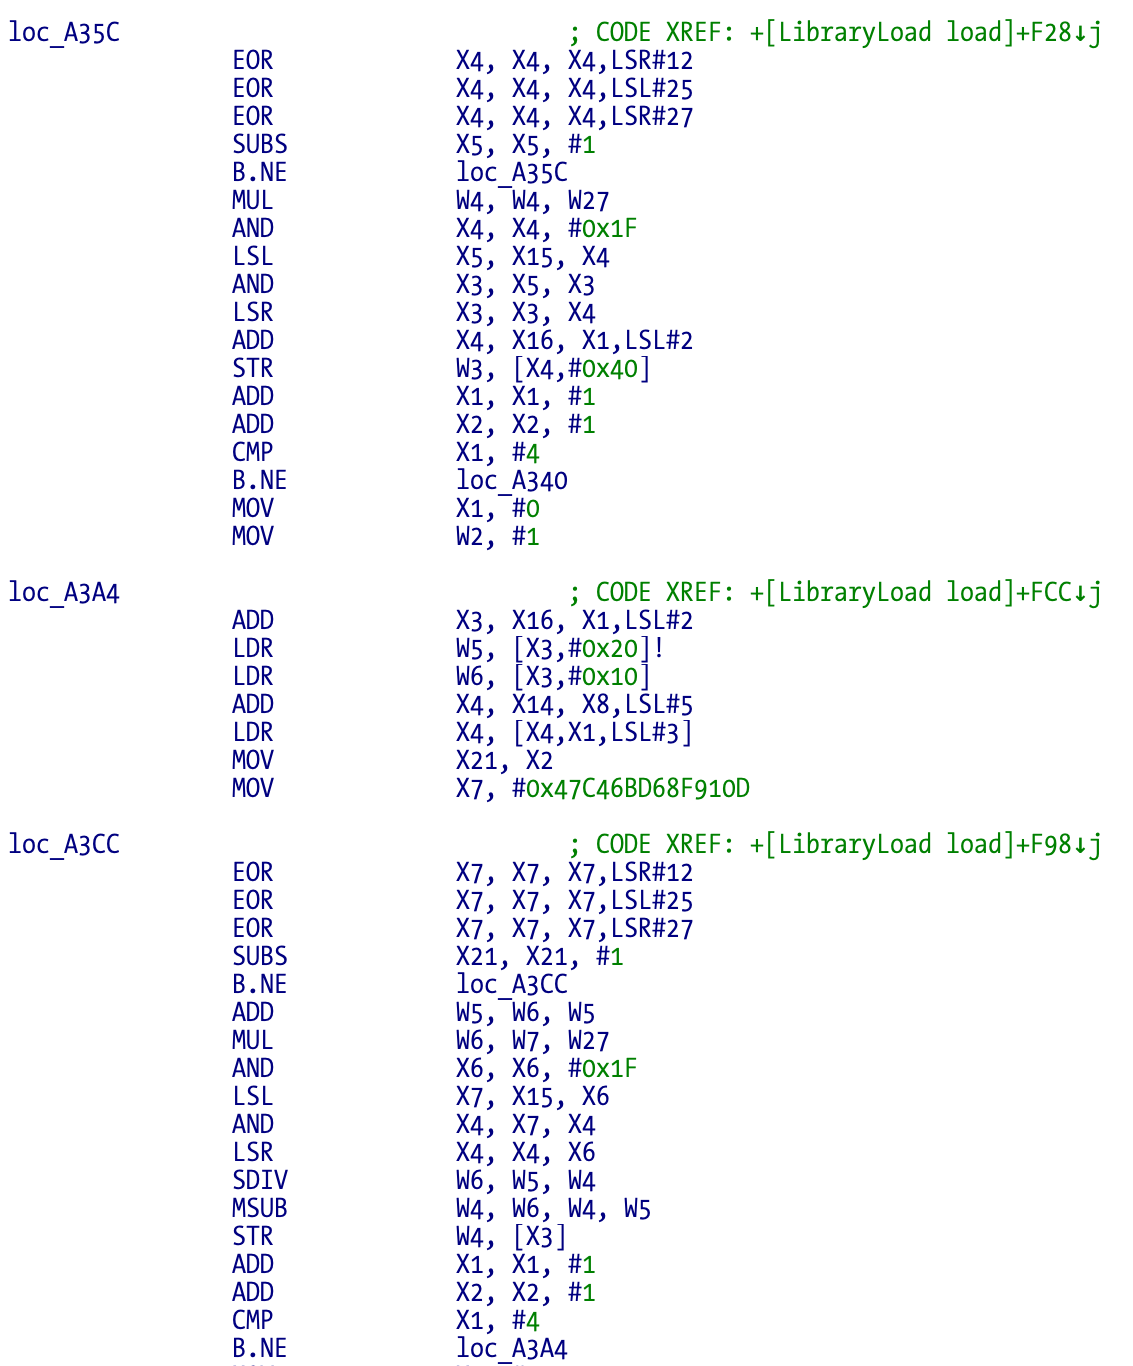
This code feels ugly, boring, and maybe unnecessary to understand, at least for now. If you are lucky ($$$) enough, the decompiler is a modern tool that can be very helpful to deal with these problems. When it was launched I wasn’t a fan of the Hex-Rays decompiler, but it became a very powerful and useful tool. Sometimes it fails subtly and badly, and leads you into some weird rabbit holes if you don’t pay attention to the original machine code. Experience, lots of frustration, and failure - the life of a reverse engineer.
The reason that it’s worth to try the decompiler is that there are a lot of optimizations that it does before it produces its final output, so we might be lucky and a significant part of this long function becomes simplified in the resulting pseudocode.
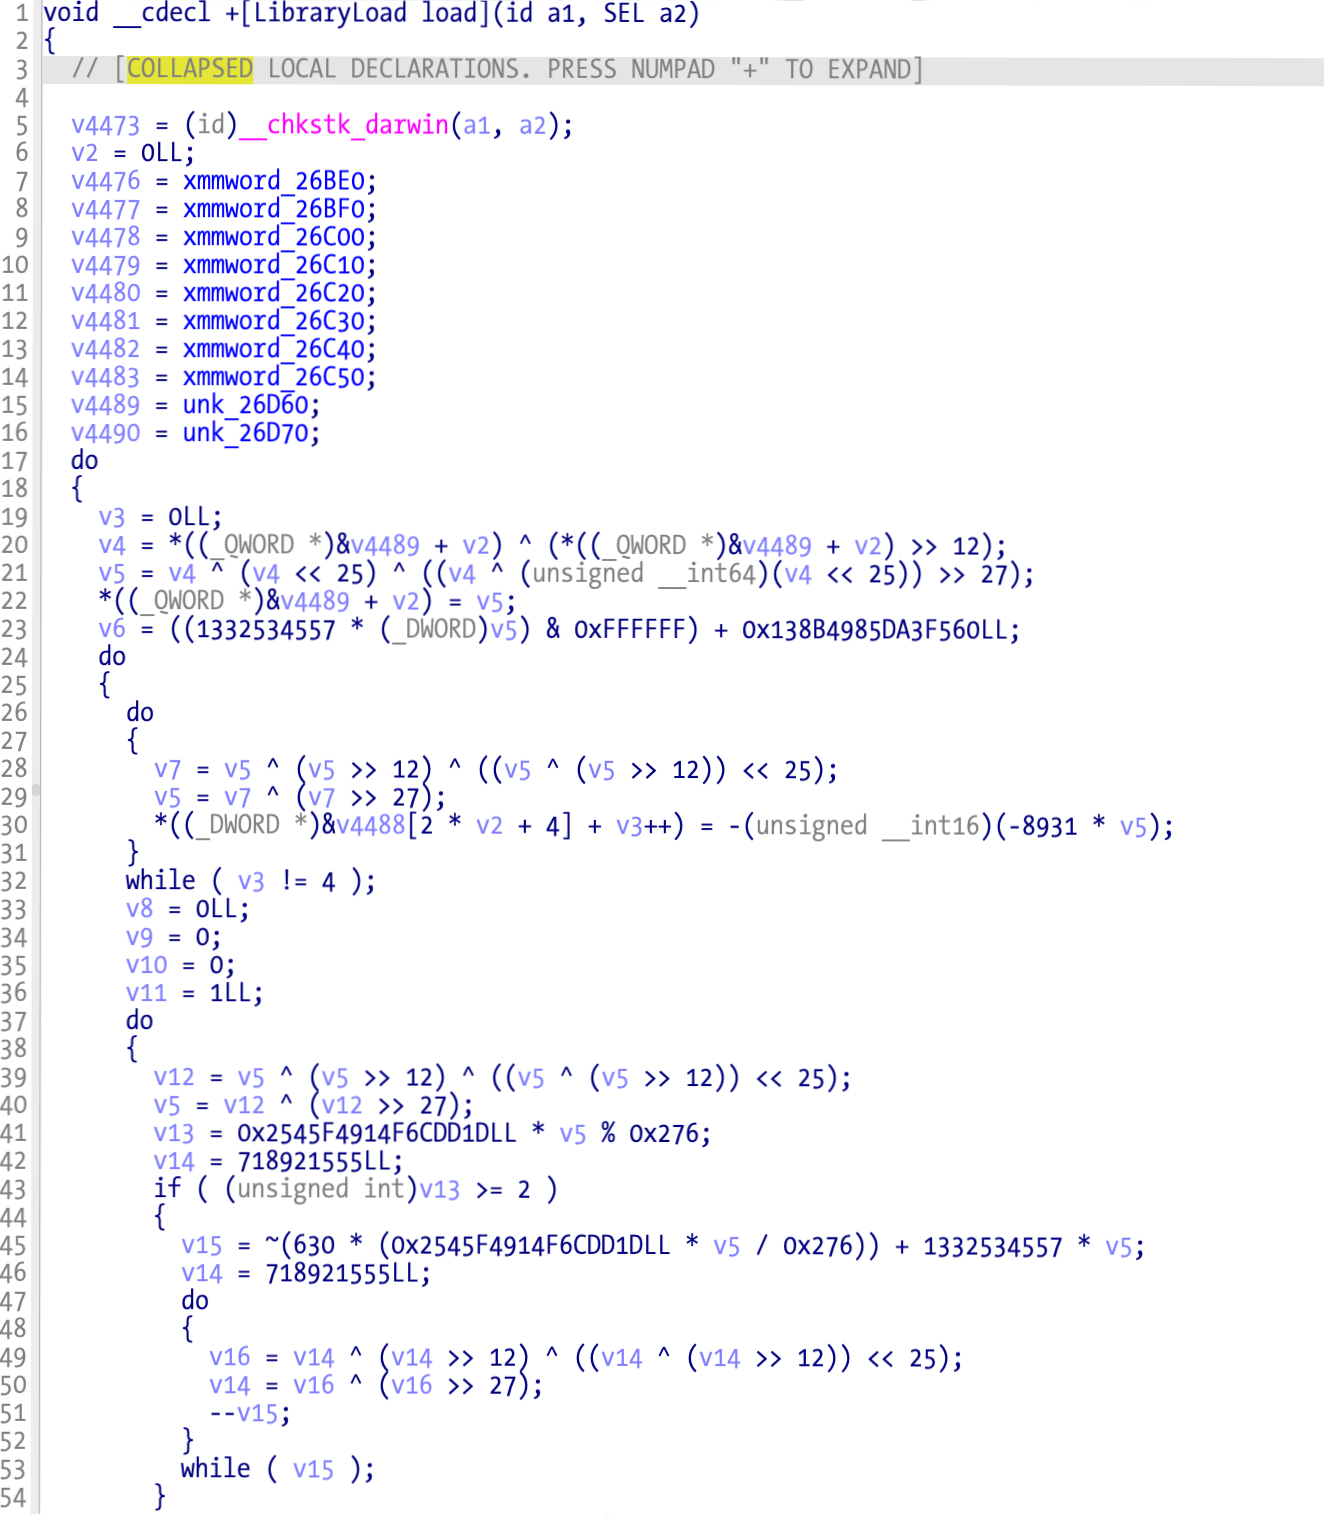
The pseudocode appears slightly better but we can still see too many loops in what appears boring code to understand and a ton of work to reverse, or to create tools to simplify all this (unless we really need them to progress).
Is there a better way? Once again, zen cracking to the rescue. Browsing around, it still feels we are too zoomed in, so what can we do to have a macro view of the code?
How about collapsing all those loops? We might lose something important inside the loops, but if this gives us a general overview then we might have a better starting point before going all crazy and waste time reversing boring and useless code. I wonder what those IDA MCP integrations popping over last days can do out of this. Need to give it a try :-).
And this simple idea is perfect. We can finally see calls to external symbols and more interesting code patterns.
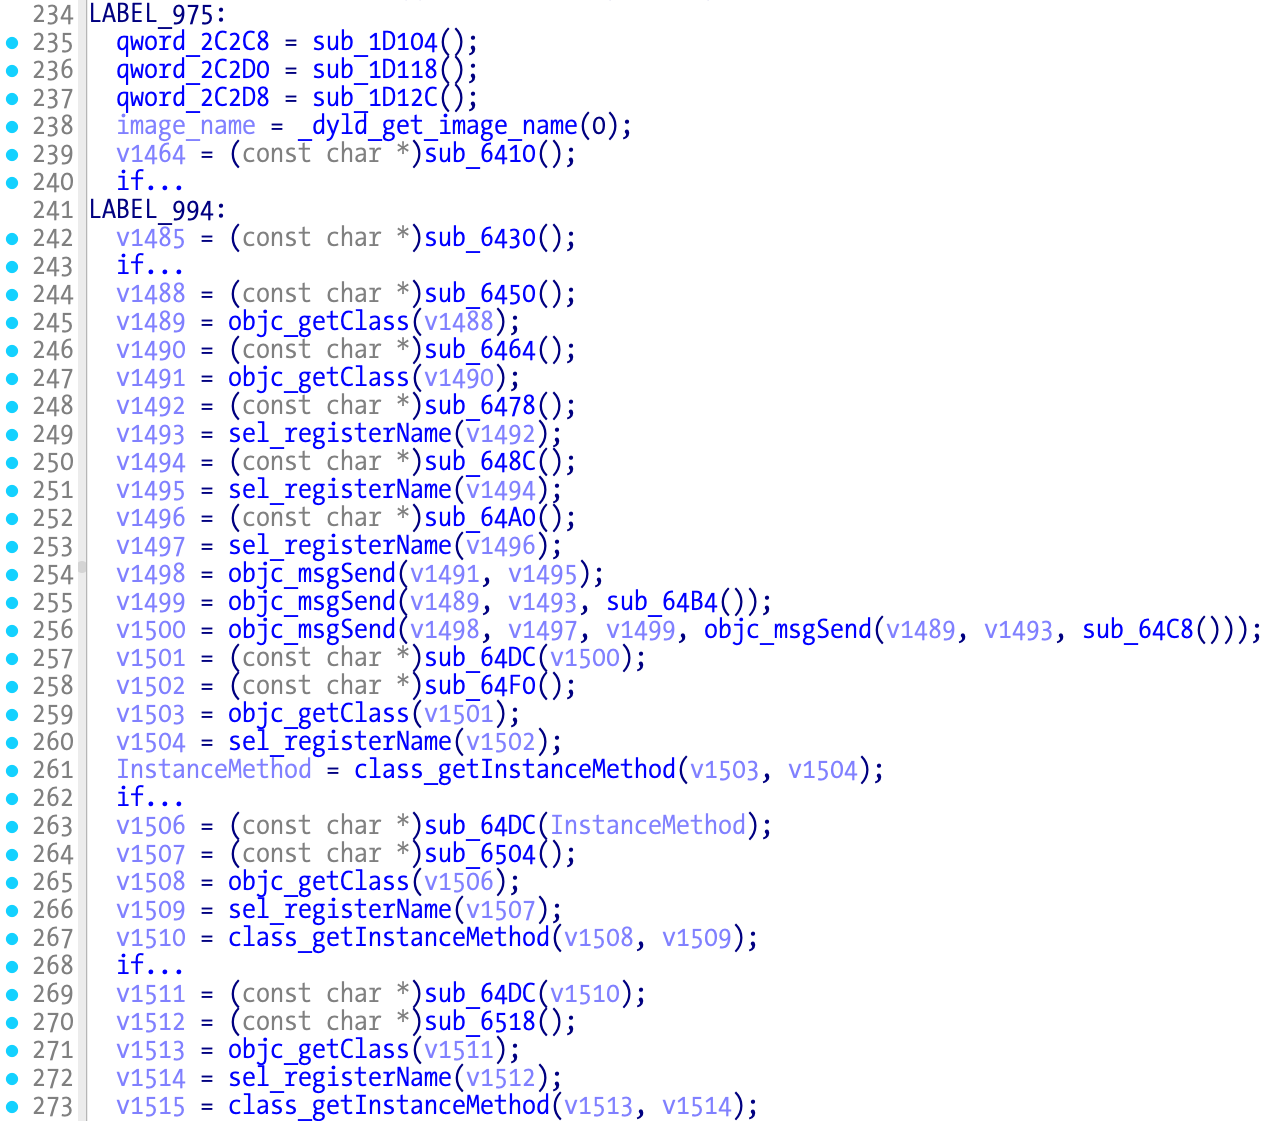
Initially I did this by hand, then I built another plugin to collapse every loop in the pseudocode view. It should be possible to achieve the same with IDAPython - iterate the CTREE, collapse all loop statements, and refresh the pseudocode view.
The anti-debugging
When we run the cracked application under LLDB it just exits. If we try it without the debugger everything appears to work. That looks like anti-debugging!
Another important detail is that the exit doesn’t happen right away. I was able to trace some amount of code and all of a sudden it exits. Apparently there is nothing in the traced code that would lead to this result.
Looking at the decompiler output, we have lots of suspicious calls to pthread_create. That suggests a thread that is suspended for some time and when it wakes up it calls exit or maybe signal to kill the main process.
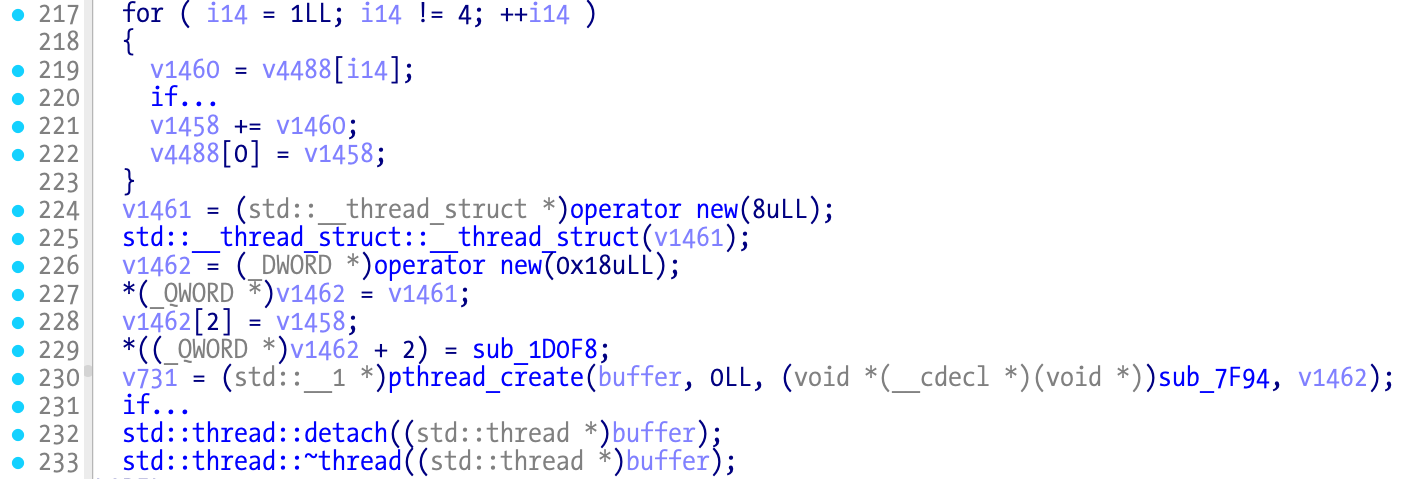
All the calls to pthread_create appear to use the same arguments so this will make our work a bit easier. The arg argument to pthread_create is a user-defined structure, where the last field appears to be a function pointer. In the previous image this is sub_1D0F8.
int
pthread_create(pthread_t *thread, const pthread_attr_t *attr, void *(*start_routine)(void *), void *arg);
The pthread start_routine function at sub_7F94 gives us some hints of what is going on. This is an intermediate function that will call the function pointer in the user-defined structure.
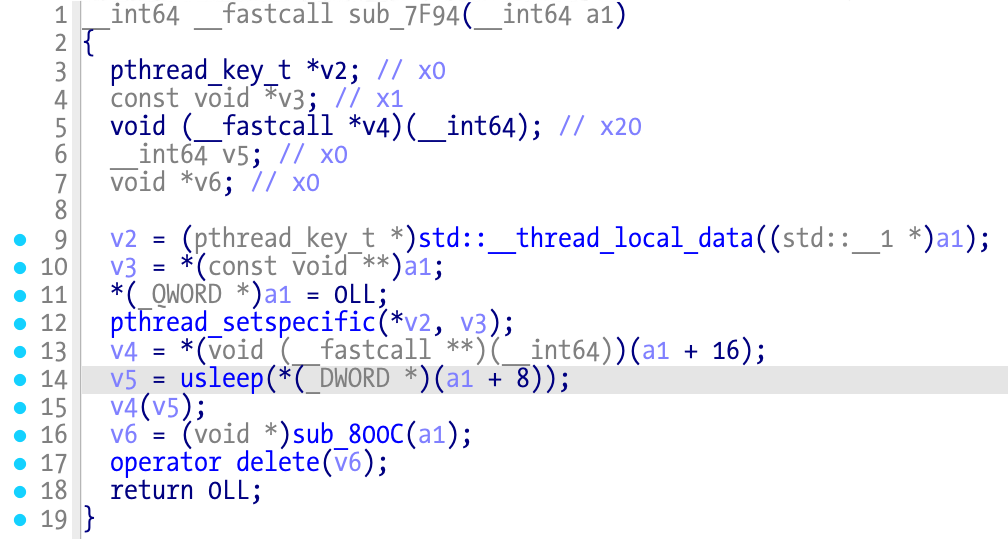
There is a call to usleep before the function pointer call v4(v5), which explains the observed delay before exit. The underlying logic is: a new thread is created, sleeps for an N amount of time, and executes another function to detect debuggers and exit if positive. All threads called this way follow the same pattern. The sleep amount is calculated somewhere in all those loops; we shouldn’t care much about it since it’s just a value. One solution could be to hook usleep and make the value so large it will never execute the function.
The function sub_1D0F8 is still an intermediate stub, meaning it will call the function we are really interested in.
void __noreturn sub_1D0F8()
{
  sub_248B8();
}
The sub_248B8 function is obfuscated with similar loops as before. But what matters is that there is an exit call and that’s more than enough to assume this is what we are looking for. These threads try to detect a debugger and terminate the application if positive.
An easy way to manually bypass this is to insert breakpoints and bypass the call to pthread_create and then jump around the next instructions that deal with the return value from that call. It is also possible to patch the library since there aren’t any checksum checks. We are free to binary patch as desired and our life becomes much easier (keep in mind that the patched code needs to be resigned because we are dealing with Apple Silicon).

In LLDB we just need to breakpoint all pthread_create calls that use that specific start_routine and advance the program counter to the right location. LLDB breakpoints support scripting so we can easily automate this. An even easier way is to runtime patch the original branches with link (BL) with a regular branch to the address we want. Insert an early breakpoint and add scripted commands to manually patch each location. In the picture above, we want to breakpoint or patch at address 0xFBEC and resume execution at address 0xFC04, since we don’t want to deal with potential bad object to detach, although we might want to jump instead to address 0xFBFC to run the destructor and avoid memory leaks (irrelevant to our case anyway).
Because this is a dynamic library, we don’t know the base address where it will be located in memory. One way to solve this, is to use lldbinit breakpoint on module load feature using the bm command. This feature detects when the specified dynamic library or framework is loaded, displaying the base address before any of its code is executed, and giving us an opportunity to set breakpoints in the library after we add its base address to the locations we have in the disassembler.
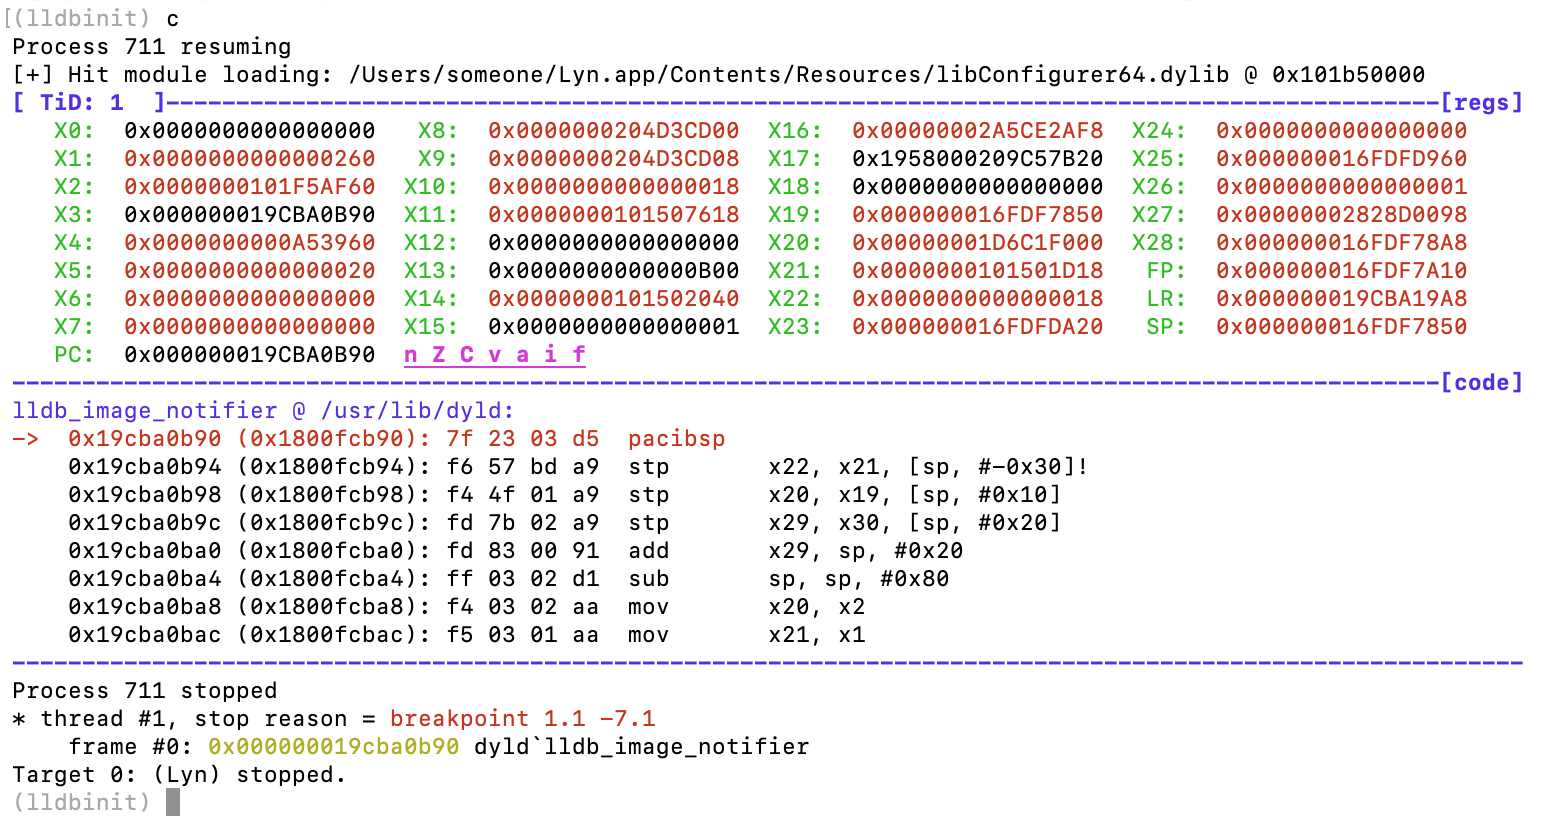
With patches applied, the application now loads correctly under the debugger, and my favorite tool is ready to rock’n’roll.
At the time I didn’t care about understanding the debugger detection mechanism. When reversing the x86_64 version I finally noticed what was going on because it was breaking things in a different way. More on this later on.
With hindsight benefit it’s quite easy to see what’s going on and implement an even easier way to bypass it.
Hidden in the loops we have this block of code:
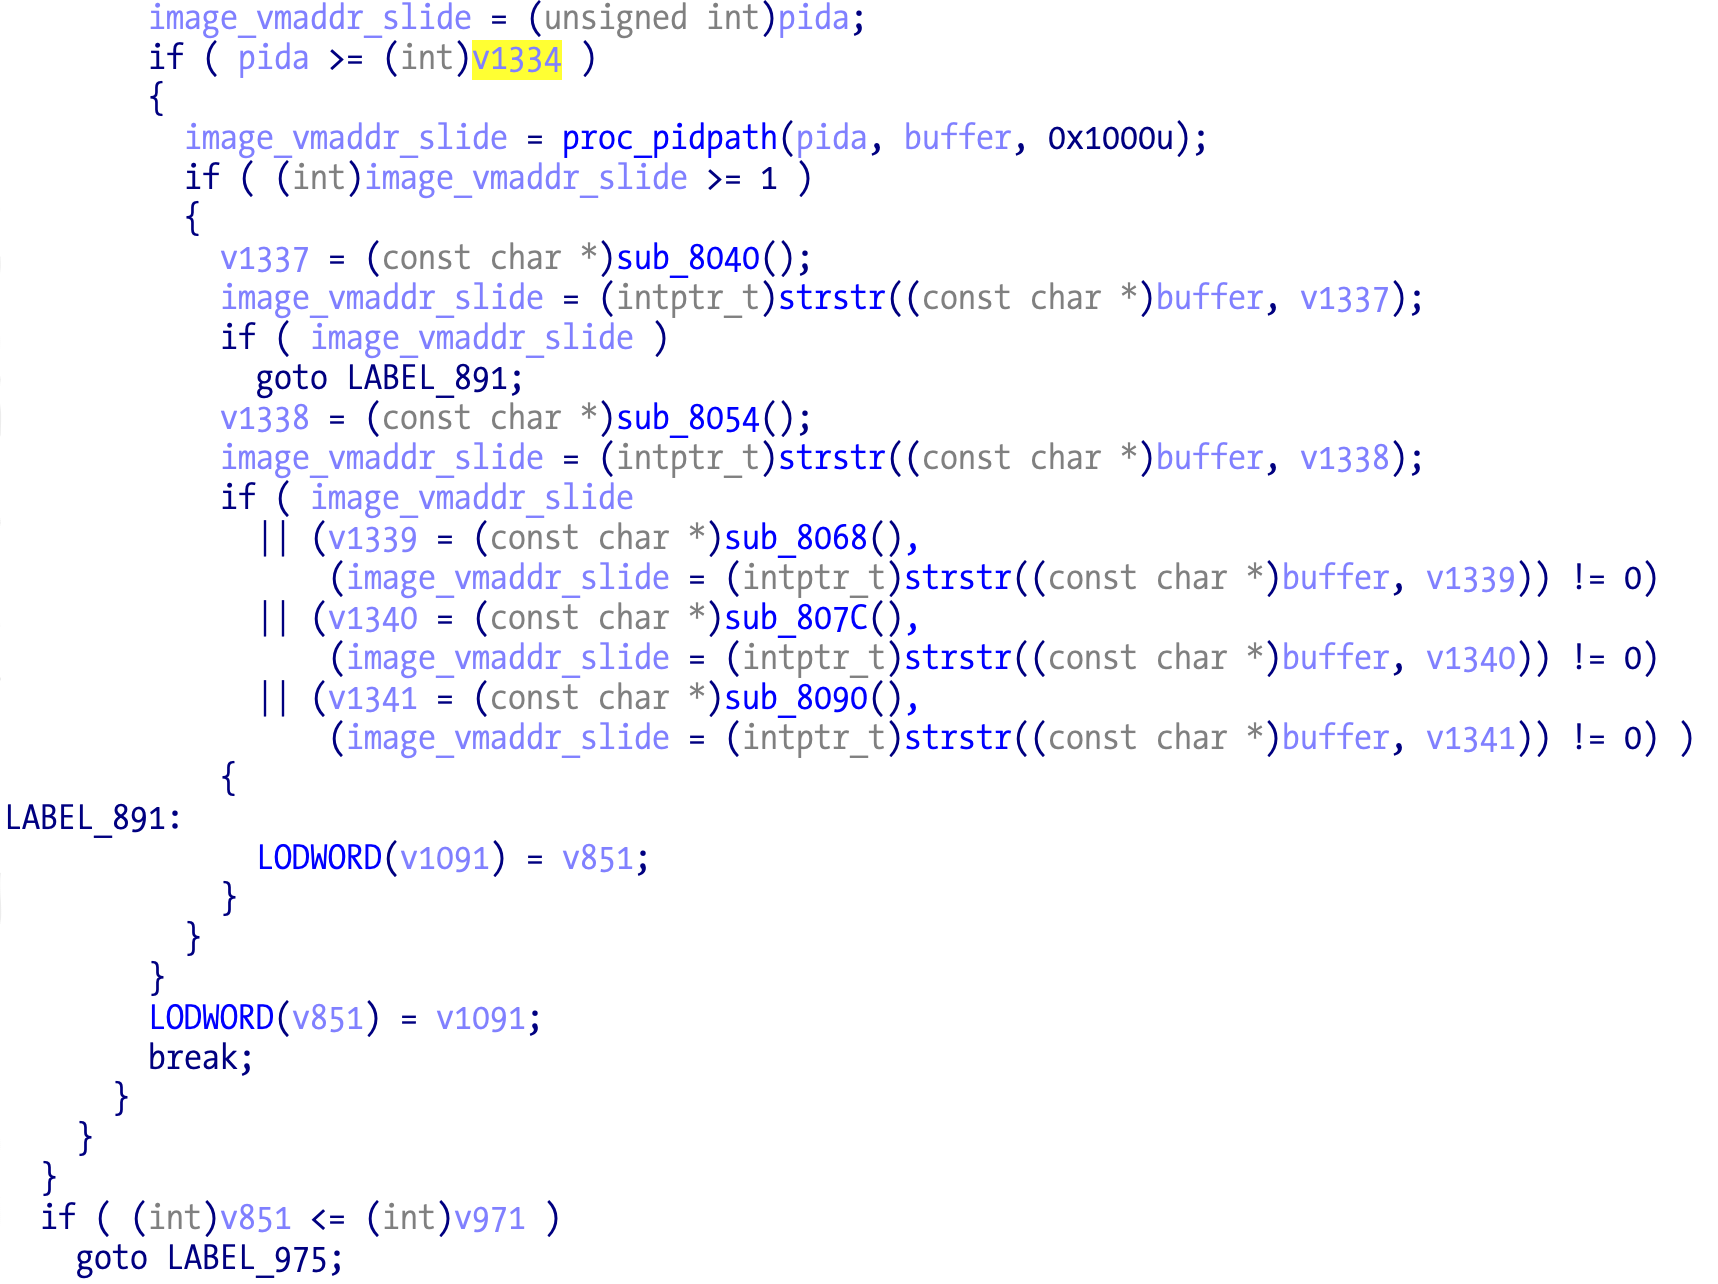
It’s essentially trying to retrieve the full path of a process. And then trying to match to a few obfuscated strings (discussed next):
- gdb
- lldb
- debugserver
- mac_server
- opper
If the debuggers aren’t detected then the anti-debugging thread installation will be skipped when execution resumes at LABEL_975 as we can see in the next pseudocode snippet:
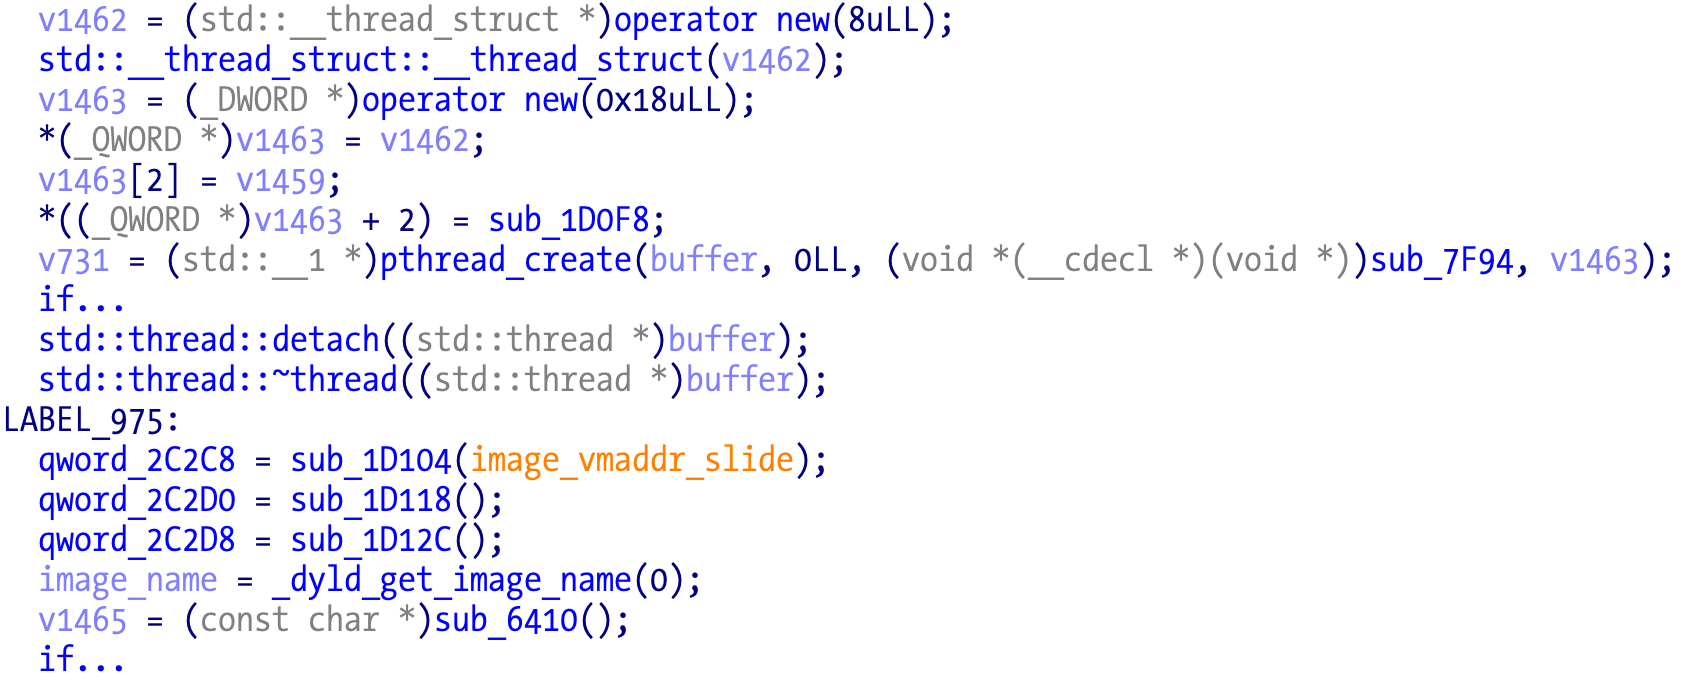
Changing the process names will bypass this, or patching the jump to label condition, or inverting the variable being set, and so on. Many options are available. The pthread_create might be the easiest one because it’s very easy to detect using the decompiler CTREE AST. This is what I implemented in C4:
[DEBUG] ******** Locating anti-debugging calls ********
[DEBUG] => Found pthread call @ 0xc6f0 @ offset 0x586f0 patch with 06 00 00 14
[DEBUG] pthread start_routine is 0x7e0c
[DEBUG] Real ptrace function var: v730 @ 0xc6c1 => 0x1cf7c
[DEBUG] => Found pthread call @ 0xfa64 @ offset 0x5ba64 patch with 06 00 00 14
[DEBUG] pthread start_routine is 0x7e0c
[DEBUG] Real ptrace function var: v1462 @ 0xfa35 => 0x1cfb0
(...)
With this information it’s very easy to patch the library, or emit LLDB scripts to patch before executing, or breakpoint commands to patch in realtime. The hard work is writing the tool to find the right locations.
The obfuscated strings
With anti-debugging out of the way it’s finally time to start poking around the rest of the code. The disassembler is unable to detect any relevant strings other than Mach-O and Objective-C related. There’s also a funny string ripped out from Hopper:
(c) 2014 - Cryptic Apps SARL - Disassembling not allowed.
Also this one that so far haven’t seen any usage for (some encoded TNT team debugging strings?):
VfhT2zwxQpLeHRL6j4Oe4mrsmrjEAW
A lack of readable strings is usually a good indicator that they are obfuscated/crypted/hidden/etc. The CIA malware development tradecraft has advice to obfuscate only what you need so and keep everything else so the binary doesn’t look suspicious. Always follow best practices:
DO obfuscate or encrypt all strings and configuration data that directly relate to tool functionality.
Verifying the code that follows the anti-debugging thread calls, we can observe suspicious functions that appear to be doing something with weird strings/buffers, a strong indicator of deobfuscation operations.
This code screams string deobfuscation right away:
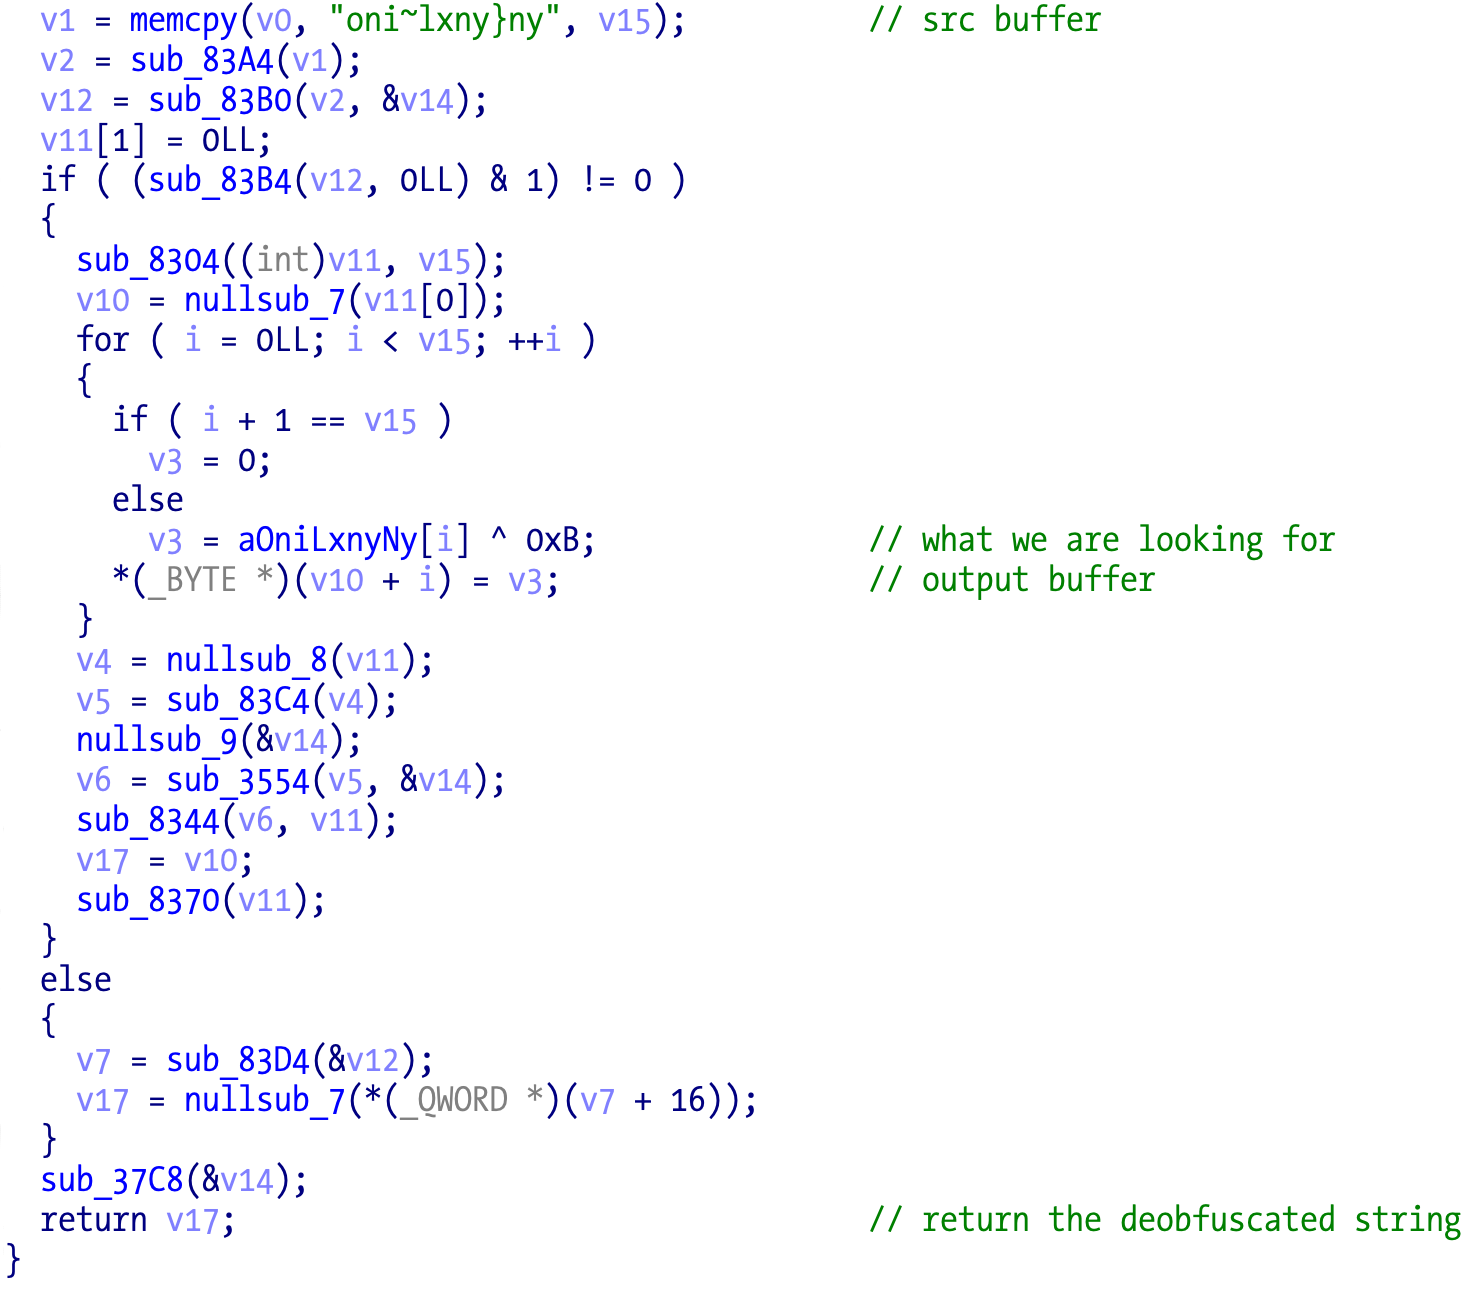
The easiest way is to breakpoint on the next instruction after the call to the function and examine the return point to see if it contains a string. Right on the money! We can see it live by setting a breakpoint after the return from the call:
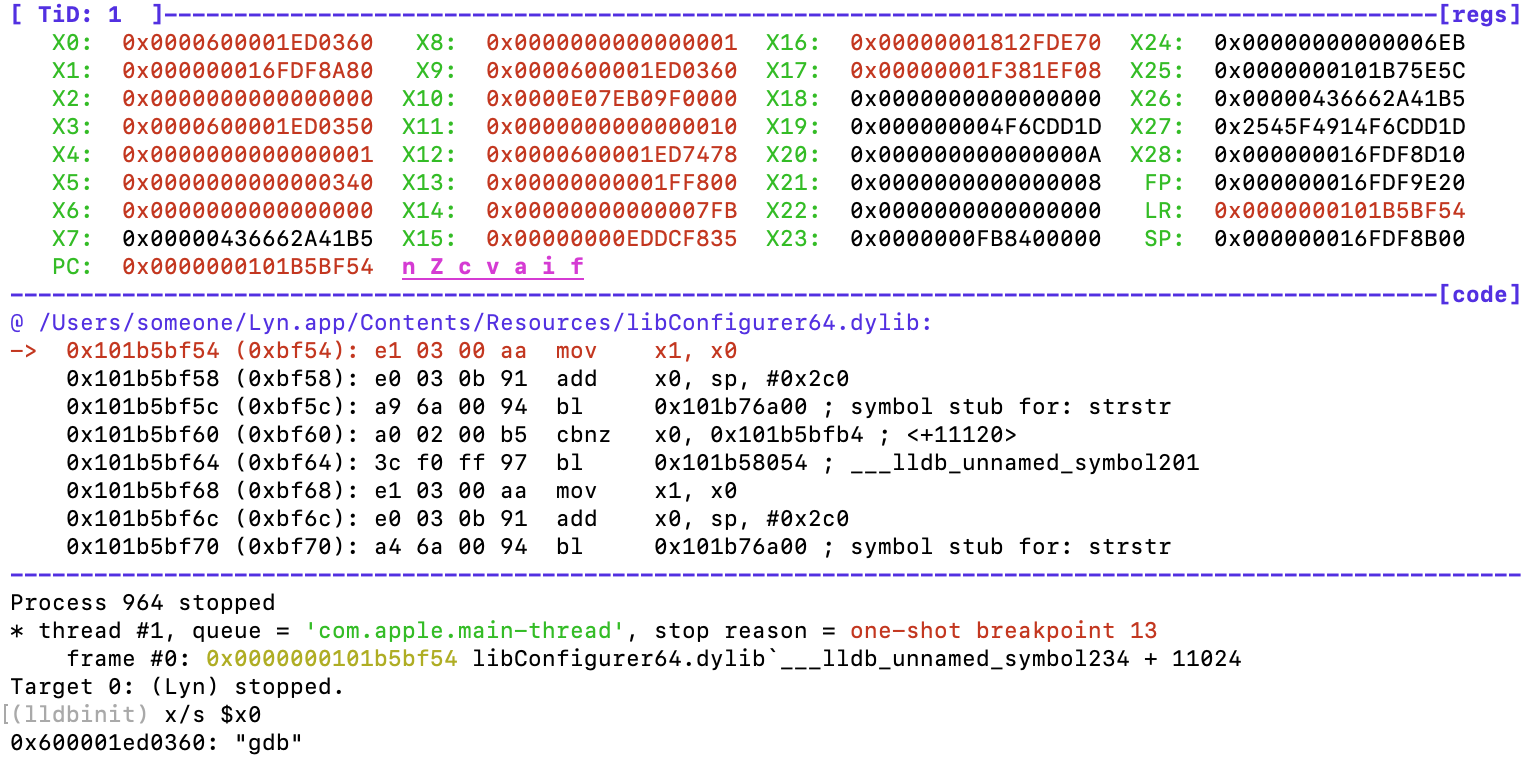
As with the anti-debugging, there is an intermediate stub before the real function. The source code could be something like this:
char * deobfuscate_string1(void) {
	// deobfuscation string
	return buf;
}

char * intermediate_stub1(void) {
    return deobfuscate_string1();
}

@ implementation LibraryLoad

+ (void)load {
    (...)
    char *string1  = intermediate_stub1();
    (...)
}

@end
The C4 tool uses this feature to detect and rename all the string functions. First it enumerates all the functions that return the result of a call, and then tests if the call target is a function that contains a call to memcpy. Other features could have been added to reduce false positives but in this particular case it works pretty well since memcpy appears to be used only in these functions. Another feature could be the XOR operation. IDA’s Hex-Rays CTREE API makes this analysis rather easy, and it’s adequate enough since we don’t need to modify anything, otherwise the microcode API is more adequate. One advantage is that the same code can deal with x86_64 and ARM64 versions unmodified since the decompiler does the dirty translation work for us and we pretty much obtain the same pseudocode for both architectures.
[DEBUG] Initializing IDA library
IDA identified 324 functions.
[DEBUG] It's a argless return call @ 0x26a8. Call target is 0x4ff8.
[DEBUG] It's a argless return call @ 0x26bc. Call target is 0x4df8.
[DEBUG] It's a argless return call @ 0x26d0. Call target is 0x4bf8.
[DEBUG] It's a argless return call @ 0x26e4. Call target is 0x49f8.
It’s also easy to statically extract all obfuscated strings since it’s just a single byte XOR obfuscation. We just need to recover the source buffer and the correspondent key. Different keys are used so we need to iterate over each function and extract the source data and the key. Once again, it’s easy to implement using the CTREE API and the super useful hrdevhelper plugin to visualize the tree.

To detect the memcpy, we can iterate the AST, find expressions of type cot_call (check the hexrays.hpp include in IDA SDK), and then check if the cot_obj in the next branch references the _memcpy symbol. This requires unobfuscated symbols to work, which isn’t a problem in the ARM64 version but it is in x86_64. The semtex tool fixes the symbols table so that IDA has the correct symbol names. That’s probably an IDA improvement, to use the LC_DYLIB_INFO segment for symbols instead of the old segments (or at least make it user configurable).
The crack implementation
Having access to the original strings the rest of the code is pretty easy to understand. It is indeed using traditional method swizzling, locating the target method(s) and then replacing the implementation with a new one. The replacement methods are super simple and usually just return 0 or 1.

So in the end nothing special about the crack library after we bypass the junk code and access the original strings. No obvious malicious intent has been detected so far but I didn’t look deep in the code. There aren’t obvious signs, but this could be easily hidden since the code is running in the same space as the target application and has easy access to dynamic libraries, so it could resolve anything it needs in runtime and not be present on its imports for example.
The possibility exists and it’s very easy to implement. Don’t forget that by running in the same process space, the crack library inherits all the permissions that you granted to the application, so that it can have access to files and network. For example if you use a firewall such as Little Snitch and trust the application to connect anywhere, then a malicious crack could be easily used to “silently” exfiltrate data and/or communicate with a C2. Or ransomware too many things if granted full disk access or just important data such as documents or pictures.
The x86_64 binary
With a reasonable understanding of the crack main features, it’s time to turn out attention to the obfuscated x86_64 version. Since I was doing most of the reversing work on a Apple Silicon based machine, I decided to start writing a Unicorn Engine based emulator. Why do things the hard way? The email author mentioned that he was able to dump the binary from memory so that was not a fun challenge and learning opportunity. I also have lots of Unicorn based code from other projects so it would be a lot less work. Yeah, LLMs can’t deal with this, easier to just copy and paste from other projects, assuming I can find where that code is :P.
Emulation is also a good option against a dynamic library since we can just run its code without using the original linked application or own stub. Useful when dealing with a sample obtained from VirusTotal without the main application.
The first problem was an instant crash inside the emulated application:
mov     rax, cs:___stack_chk_guard_ptr
mov     rax, [rax]
Originally I mapped the application at memory address 0x10000000, and since ___stack_chk_guard is an external symbol and my emulator code wasn’t resolving them, the pointer was set to 0 and so the NULL dereference was breaking things. Unicorn has unmapped memory hooks to detect this kind of issues so no need to map the NULL address as the real macOS does.
We can solve this problem in so many different ways:
- NOP the dereference.
- Point RAX to a valid memory address.
- Enable a Unicorn code hook and advance instruction pointer to skip the dereference.
- Go full crazy and implement the external symbol solver.
- Whatever else you can come up with.
Because my brain sometimes goes wild and just wants to close the problem without thinking too much, my first instinct was to replace the first instruction mov rax, 0x31337, and NOP the second. Not even sure why given that we only need to NOP the second. Later on this was unnecessary because I started mapping the library at address zero due to other issues.
The patch happens before we start executing the code in Unicorn. We have full control of the memory contents mapped to Unicorn so this is a nice and easy way to introduce code patches before emulation even starts.
Patch implemented and off we go to the next problem.
External function calls
The next crash happens with a call to an external function. In this case it’s mprotect.
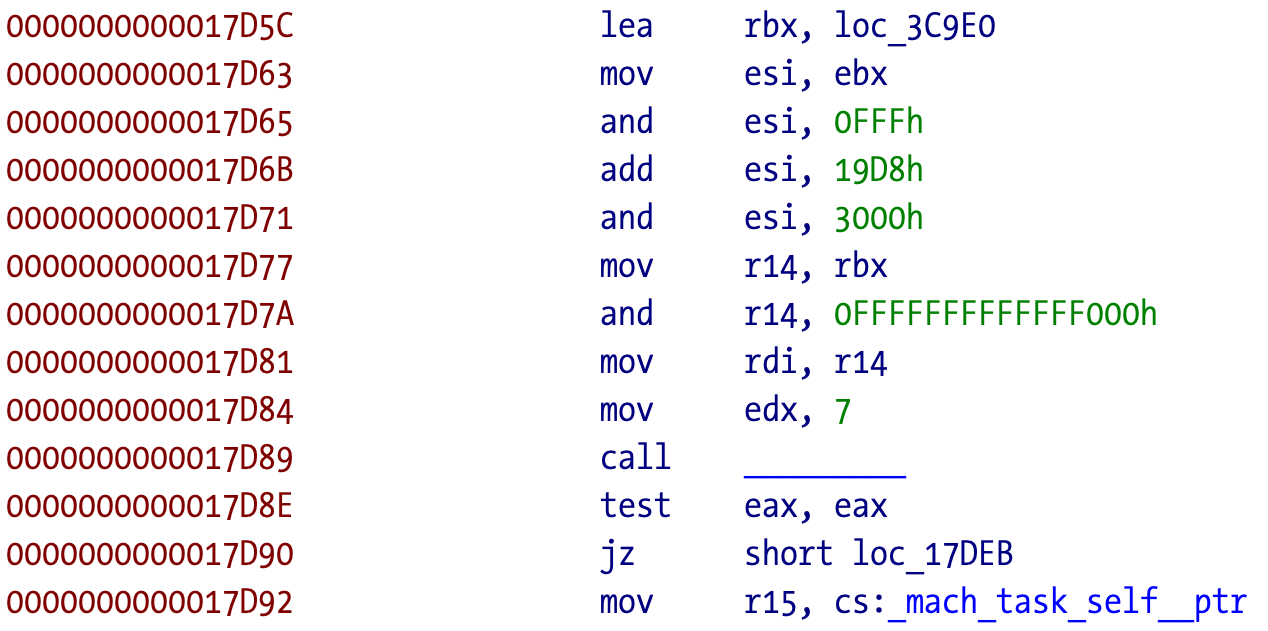
We know it’s mprotect because that information is available in the stub:

The mprotect prototype is:
int mprotect(void *addr, size_t len, int prot);
Because I initially mapped the Unicorn memory as RWX I don’t need to care much about emulating the original function other than returning zero as a successful call.
To achieve this, a UC_HOOK_CODE hook is defined. There is an instruction hook UC_HOOK_INSN but Unicorn Engine is limited in the number of supported x86_64 instructions (basically it’s in, out, and some other). The code hook is called on every instruction executed. This can be useful to debug the execution when developing the emulator, or to generate an execution trace for analysis using a tool such as lighthouse. Printing to the console can slow down the emulation, otherwise the performance is very high on any modern CPU, Apple Silicon in particular.
Initially the addresses were hardcoded but later, a Mach-O parser was added to discover all this automatically and emulate other samples. The addresses are from the symbol stubs (the jump to the pointer that is solved by the linker when called the first time) since it’s guaranteed that all the calls to the symbol will go through that jump. This way we just need to intercept a single address to discover all the callers to that particular symbol.
If the call to mprotect fails then the code tries to use vm_protect, which has the following prototype (identical to mach_vm_protect):
kern_return_t mach_vm_protect
(
        vm_map_t target_task,
        mach_vm_address_t address,
        mach_vm_size_t size,
        boolean_t set_maximum,
        vm_prot_t new_protection
);
That’s why we see the reference to mach_task_self - it wants to change memory permissions on its own task instead of a remote task.
The code then proceeds to do a small initial XOR decode with a fixed key. I didn’t reverse what is the role of this but might be related to calculation of other values. Maybe homework for you the reader?
The execution breaks again at another unimplemented external function, _dyld_get_image_vmaddr_slide. This happens after some 9 kbytes of code doing similar loop operations to the ones shown for ARM64. Its prototype can be found in system includes at mach-o/dyld.h. This function purpose is to return the ASLR slide of any image mapped in the application memory space:
intptr_t _dyld_get_image_vmaddr_slide(uint32_t image_index);
The emulator doesn’t implement ASLR but this is an easy function to emulate. We can extract the argument to the call and just return the zero value, meaning that the target process has ASLR disabled, which normally happens when starting the applications under a debugger to have stable addresses between executions.
After this function is emulated, the code resumes execution with quite a few calls to mprotect in different memory areas and then it finally crashes with a weird instruction error.
At this point I wasn’t sure about errors in the emulator since I started writing it without debugging the target application. Emulation is easier when you understand how the target works. Debugging was an opportunity to see if the behavior was the same or there was some mistake in the emulator.
Before that I tried to use different ASLR return values. The crashes and execution trace were slightly different so that was an hint something fishy was going on.
The initial anti-debugging trick
Running Lyn.app under LLDB generates a weird crash but running it outside the debugger works fine, so definitely something weird is going on.
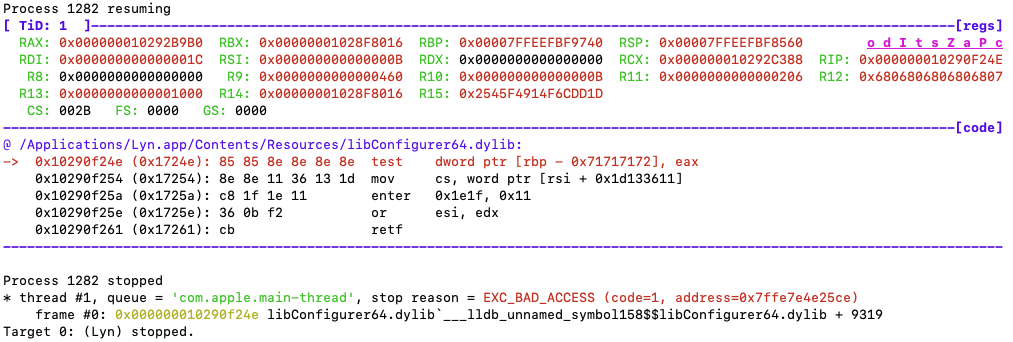
If we take a look at the disassembly around the crash address:
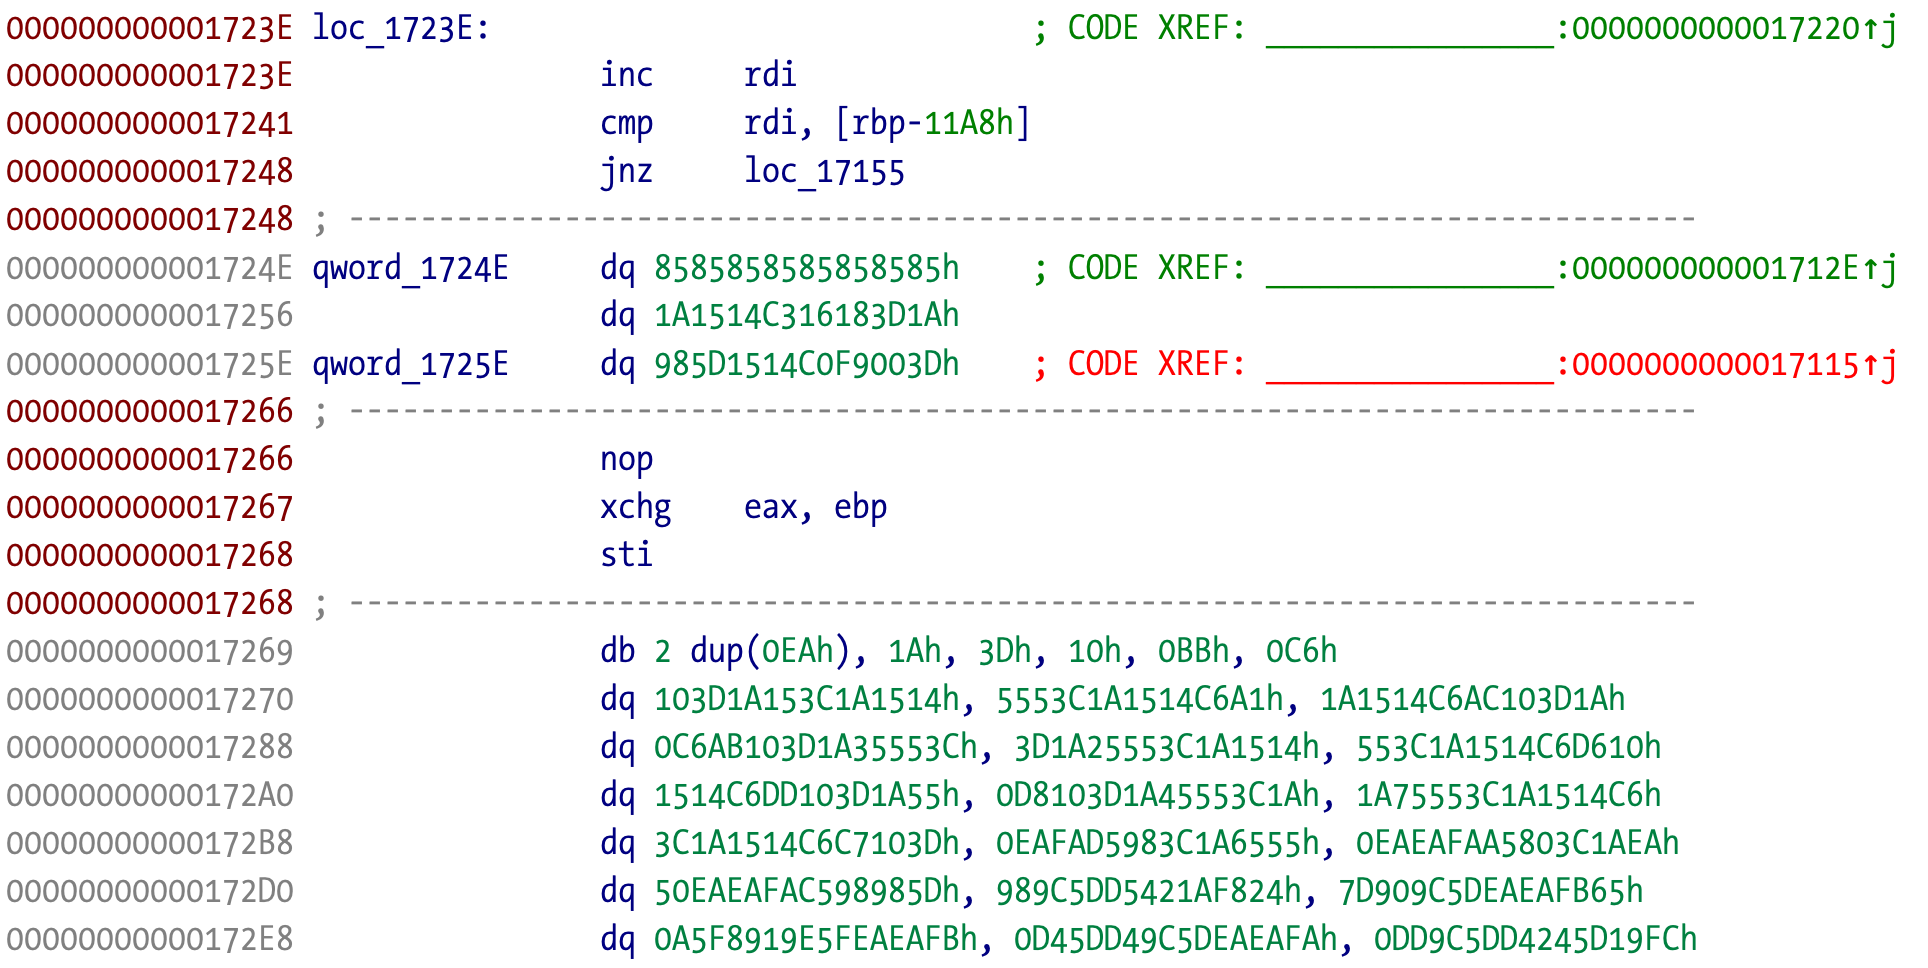
The original bytes at the crash address are meaningless and different from the bytes we have in LLDB, meaning that the code was transformed after address 0x17248. If we pay attention to the code in LLDB we can observe it makes no sense. The enter and retf instructions aren’t common at modern user level code (usually in old 16 bit and segmented code). Something is rotten here!
I forgot to mention that before using the debugger I tried something else. Unicorn also contains very useful memory hooks. One that I usually implement is UC_HOOK_MEM_UNMAPPED to detect all types of unmapped memory access, usually a sign of broken and/or missing emulation. But there are also hooks for successful memory accesses such as read and writes. If we suspect that the code is deobfuscating/decrypting/unpacking/etc, we can setup a UC_HOOK_MEM_WRITE hook and find out exactly where in memory it is writing, and extract those (hopefully) clear bytes. And since we know the possible ranges from the mprotect calls, we can optimize the hook and set it up just on those ranges to avoid tracing all mapped memory space. And voilá, we observe the original code bytes being written with new ones, so there is some kind of transformation going on.
[DEBUG] Hit memory write at 0x3c9e0 of 1 byte(s): 0xd2
[DEBUG] Hit memory write at 0x3c9e0 of 1 byte(s): 0xd2
[DEBUG] Hit memory write at 0x3c9e1 of 1 byte(s): 0xbe
[DEBUG] Hit memory write at 0x3c9e1 of 1 byte(s): 0xbe
[DEBUG] Hit memory write at 0x3c9e2 of 1 byte(s): 0x5
[DEBUG] Hit memory write at 0x3c9e2 of 1 byte(s): 0x5
[DEBUG] Hit memory write at 0x3c9e3 of 1 byte(s): 0x19
Back to the anti-debugging…
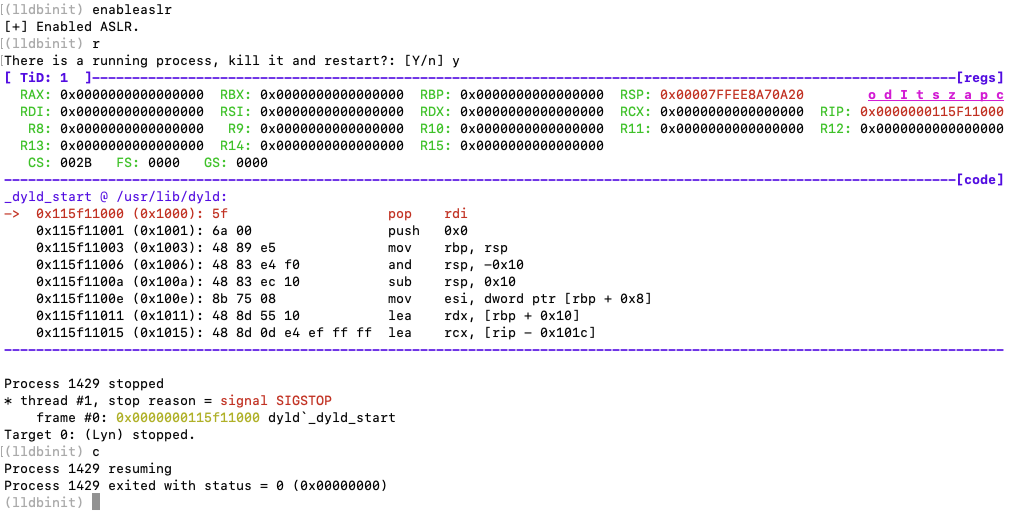
Without understanding the code we can formulate an hypothesis. If the crack runs fine without the debugger, crashes in the debugger with apparent junk instructions, and we are certain it is overwriting itself, what is different? ASLR!
It is very easy to test this hypothesis. Just enable ASLR in LLDB and run the application. Voilá, it doesn’t crash but it exits, same behavior we already saw in the ARM64 version.
This is a cute idea I haven’t seen before, to use the ASLR values to detect the debugger. That’s why the call to _dyld_get_image_vmaddr_slide exists. Let’s find out how it’s done. The call to that function plus the mach header structure have been renamed and added from the initial IDA analysis.
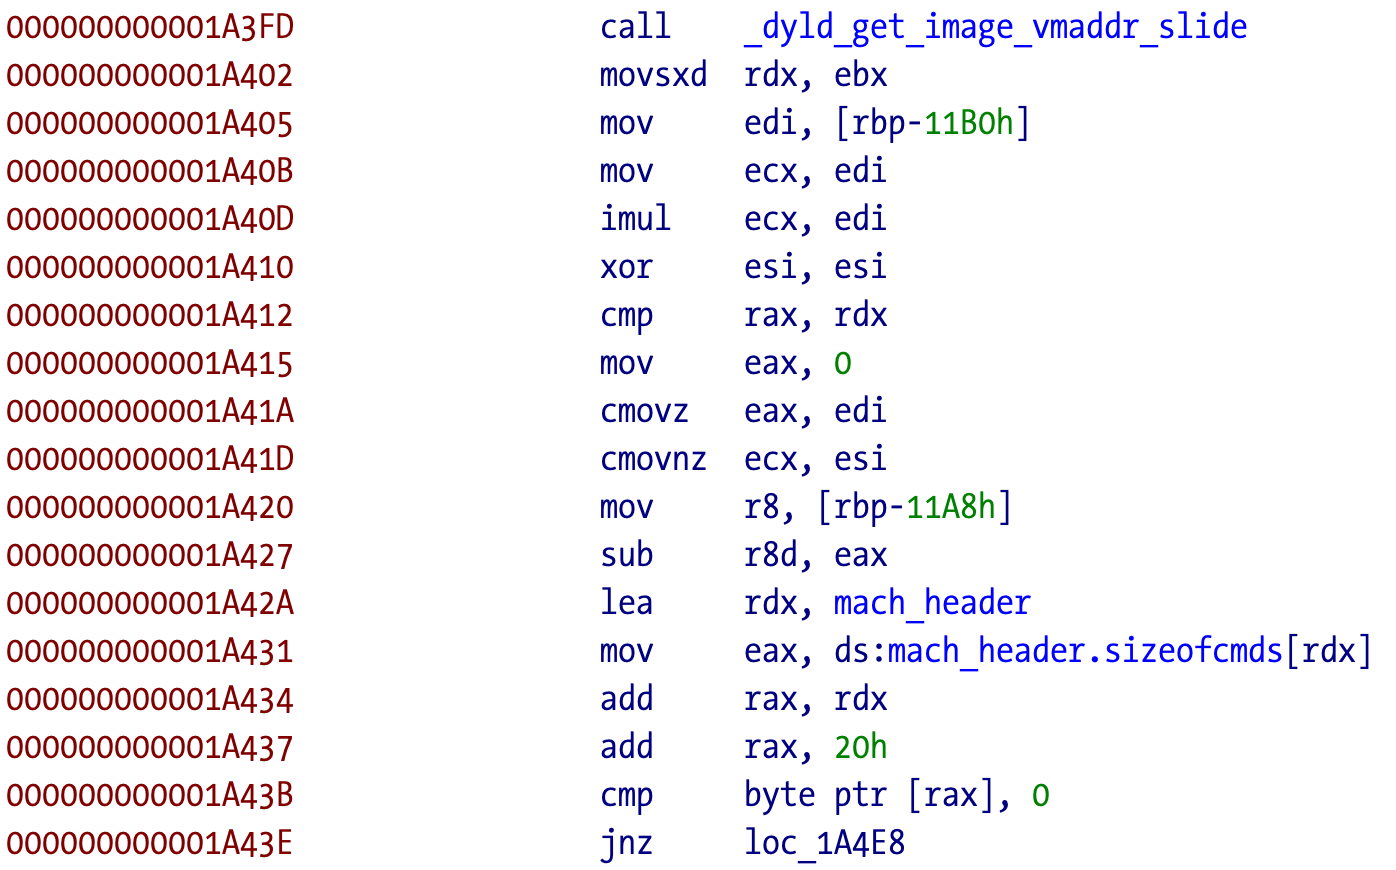
Not shown here but the value of ebx and then rdx is zero after the call to _dyld_get_image_vmaddr_slide. The return value is not compared right after the call, and then eax and ecx are set or not on the cmov instructions. The values will be different according to the return value of _dyld_get_image_vmaddr_slide. The dereferenced value of edi is always 2, meaning that ecx is 4 before the conditional moves.
We can now reverse the logic behind this check:
If the ASLR slide is zero, the zero flag (ZF) is set. The first conditional move (
cmovz) will makeeaxequal toediwhich is 2. The next move will keepecxat 4 since the move is not performed if the flag is set.If the ASLR slide is not zero, the zero flag is not set. The first conditional move (
cmovz) is not performed, soeaxwill stay zero. The next conditional move (cmovnz) will be performed (move if zero flag not set), soecxwill also be zero.
Loosely translated to C:
intptr_t aslr_slide = _dyld_get_image_vmaddr_slide(0);
int edi = 2;
int ecx = edi * edi;
int eax = 0;
if (aslr == 0) {
    eax = edi;
    // eax = 2 ; ecx = 4;
} else {
    ecx = 0;
    // eax = 0; ecx = 0
}
Or with the commented disassembly:

The code continues parsing the Mach-O header to calculate another address. It starts by loading the library base address (0 in the disassembled file, the dyld assigned base address when loaded in the process space), adds 0x14 bytes to that address, which is the location of sizeofcmds field in struct mach_header_64, dereferences that value to eax, and adds it to the base address. Finally it adds another 0x20 (32) bytes, the sizeof(struct mach_header_64 since sizeofcmds is the size of all load commands after the initial header. All this is just to know where the Mach-O header data ends.
struct mach_header_64 {
        uint32_t        magic;          /* mach magic number identifier */
        cpu_type_t      cputype;        /* cpu specifier */
        cpu_subtype_t   cpusubtype;     /* machine specifier */
        uint32_t        filetype;       /* type of file */
        uint32_t        ncmds;          /* number of load commands */
        uint32_t        sizeofcmds;     /* the size of all the load commands */
        uint32_t        flags;          /* flags */
        uint32_t        reserved;       /* reserved */
};
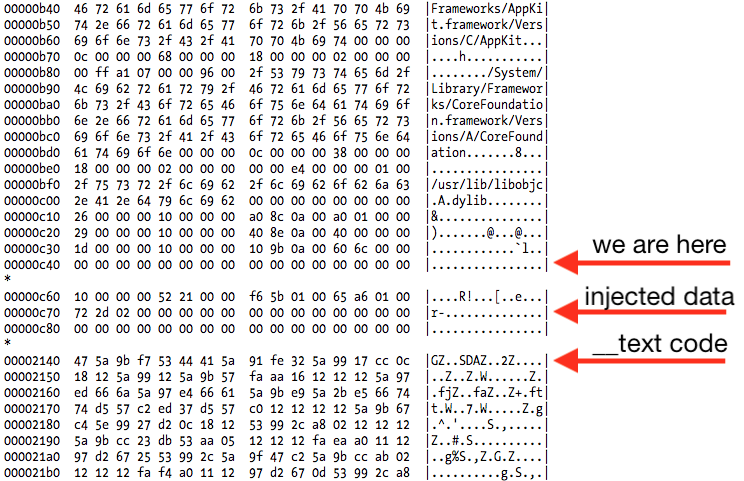
It then tries to find the location of the first non zero byte in the memory space starting at the calculated address. Normally this is zero filled padding space until the start of the first section data __TEXT/__text. The data that the code is trying to locate was most certainly injected/generated by the TNT obfuscator tool and we will understand its role next.
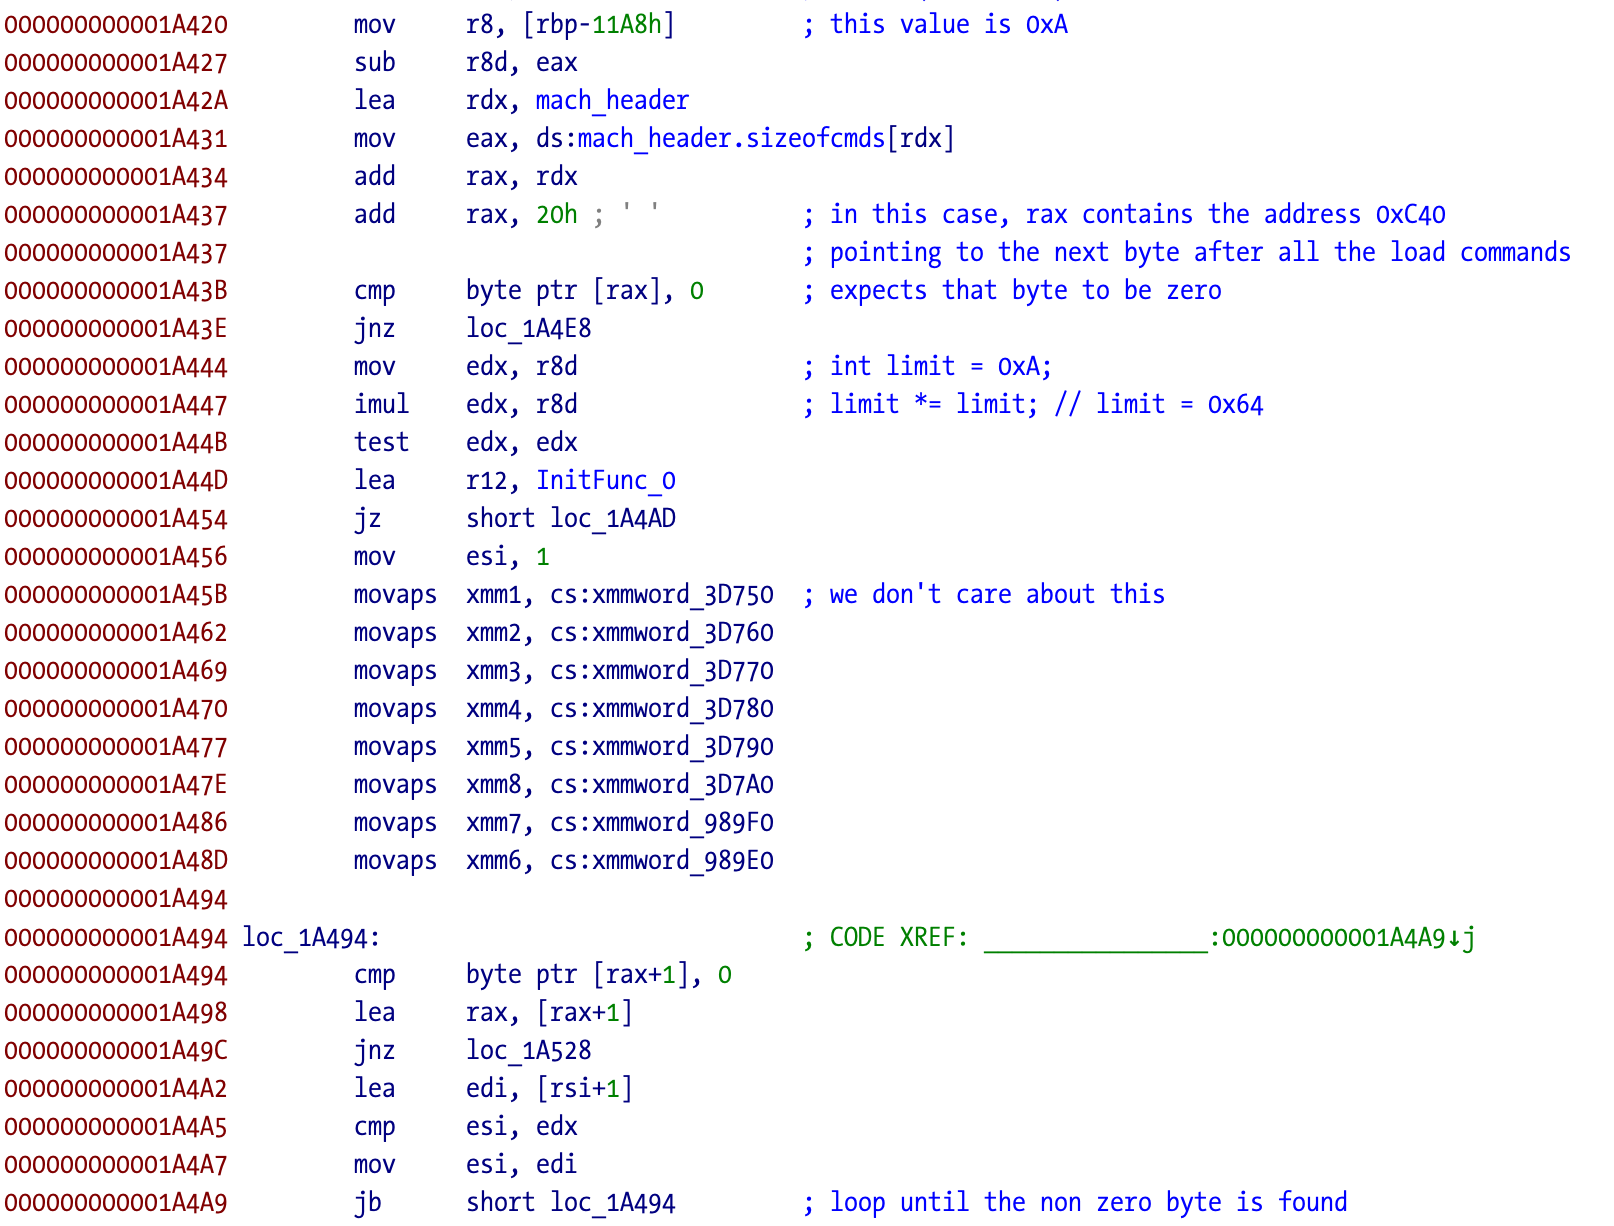
Loosely translating to C it could be something like this:
char *ptr = (char*)(base + mh.sizeofcmds + sizeof(struct mach_header_64);
if (*ptr != '\0') {
  // do something
} else {
  int limit = 0xA;
  limit *= limit;
  int i = 1;
  do {
    if (*(++ptr) != '\0') {
      break;
    }
    i++;
  } while (i < limit);
}
Visualizing the injected data in the hex dump:
The next relevant block of code generates two important values, one of which is the XOR key used to deobfuscate the code. It also becomes clear what is the role of the ASLR check - the result will be different if ASLR is enabled or not. In this case, the correct key will be computed if ASLR is enabled, otherwise the key is wrong and it will deobfuscate to bogus code sooner or later. In the case of my emulation target, it would try to deobfuscate a lot more code blocks and finally crash when it tried to execute the bad code.
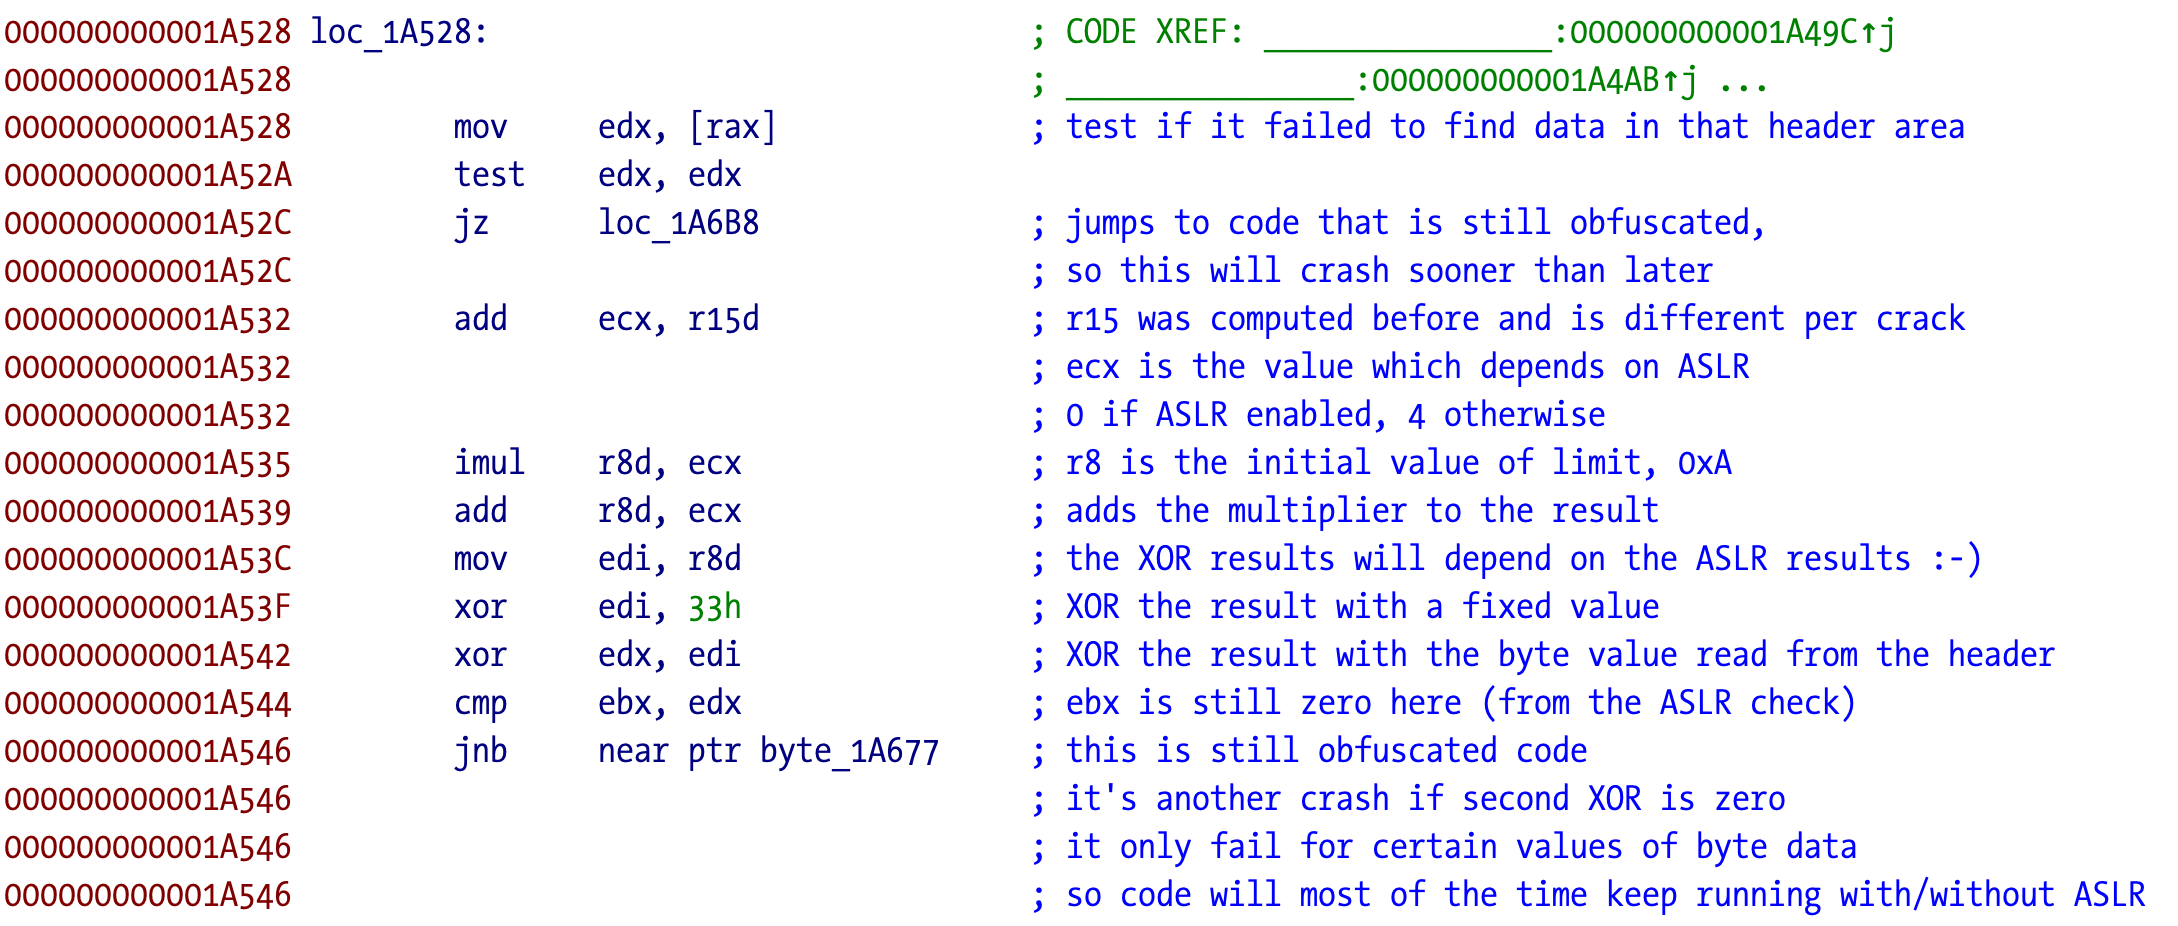
The first xor result with the fixed number is the byte key that will be used for every following deobfuscation operation. The next xor is one of those operations. Initially I didn’t pay much attention but that value is the number of elements in a structure (to be precise, the number of elements in the injected data).
The fixed value in the first xor is mutable between cracks, so the same key isn’t used on every crack. Well, technically it should repeat since it’s a single byte, so only 255 possibilities, and TNT does a lot more releases than that. The emulator initial PoC captured the XOR key with a code hook on that address, but after we understand the code this isn’t necessary at all since we are dealing with a one byte key.
We can confidently assume that the deobfuscated code for the constructor is push rbp; mov rbp, rsp with a hex sequence of 55 48 89 E5 so we can just XOR each obfuscated byte with the expected to extract the key.
Using the information from the injected data is even better. The first field is the number of elements that follow, where each element is a pair of int. If we count the number of elements we can just xor the result with the original value to obtain the key. With this information it’s super easy to build a static deobfuscator, which I just did while writing this post. In this case it’s sx4.
Using the previous injected data:
00000c60  10 00 00 00 52 21 00 00  f6 5b 01 00 65 a6 01 00  |....R!...[..e...|
00000c70  72 2d 02 00 00 00 00 00  00 00 00 00 00 00 00 00  |r-..............|
00000c80  00 00 00 00 00 00 00 00  00 00 00 00 00 00 00 00  |................|
The first int is 0x10 (big-endian), followed by two int pairs, (0x2152, 0x15bf6) and (0x1a665, 0x22d72). The XOR key is 0x10 ^ 0x2 = 0x12. To debofuscate each pair, we just need to xor the least significant byte. The deobfuscated pairs then become (0x2140, 0x15be4) and (0x1a677, 0x22d60).
The first pair is the start address of __text section, so it will deobfuscate the code from 0x2140 until 0x2140+0x15be4 = 0x17D24 (this is right before the load method we are reversing). The second pair deobfuscates the rest of the load method that is still obfuscated, from 0x1a677 until 0x3D3D7 (the end of the code section).
This is what the code that follows the key generation does, it starts reading the start and size values from that data structure, aligns addresses, and calls mprotect to make the code writable so it can be replaced with the deobfuscated version. The next two images are from the Lyn sample, with different registers and slightly different output but the source code is most probably the same (because I had that code commented already instead of the one I was presenting before).
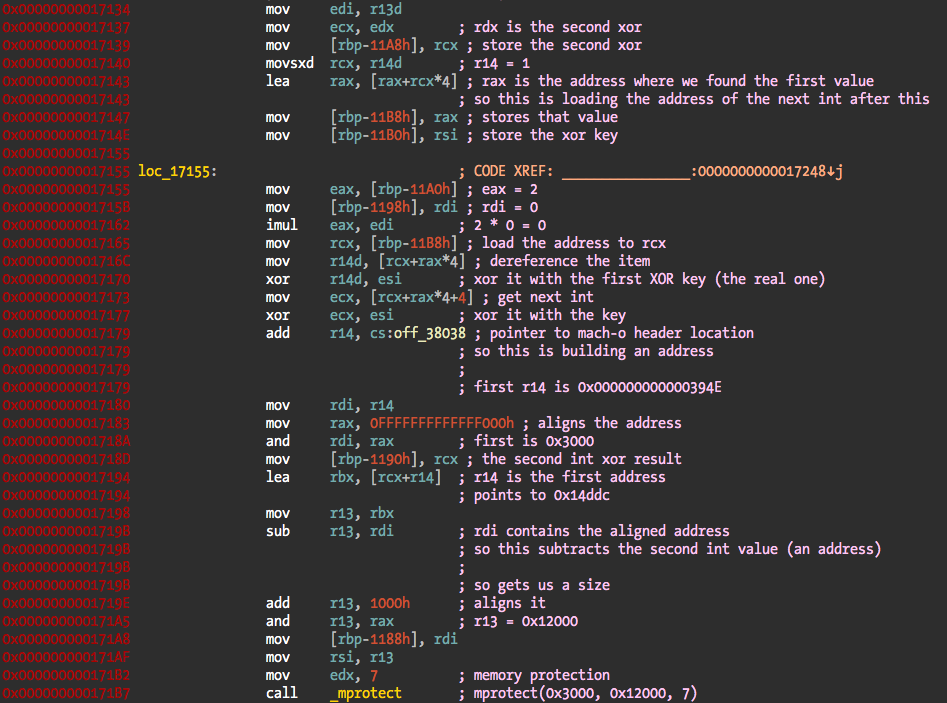
The injected data block in this case:
00000cb0  17 00 00 00 45 39 00 00  85 14 01 00 5b 72 01 00  |....E9......[r..|
00000cc0  4c d1 01 00 00 00 00 00  00 00 00 00 00 00 00 00  |L...............|
00000cd0  00 00 00 00 00 00 00 00  00 00 00 00 00 00 00 00  |................|
The XOR key for this is then 0x17 ^ 0x2 = 0x15.
The final step is to iterate over the configured memory blocks and deobfuscate each byte with a simple xor. When the loop is over the execution resumes right after the last conditional jump, in code that was just deobfuscated. If the XOR key is wrong, than the loop can go for a while and decrypt wrong areas and will certainly result in bad data.
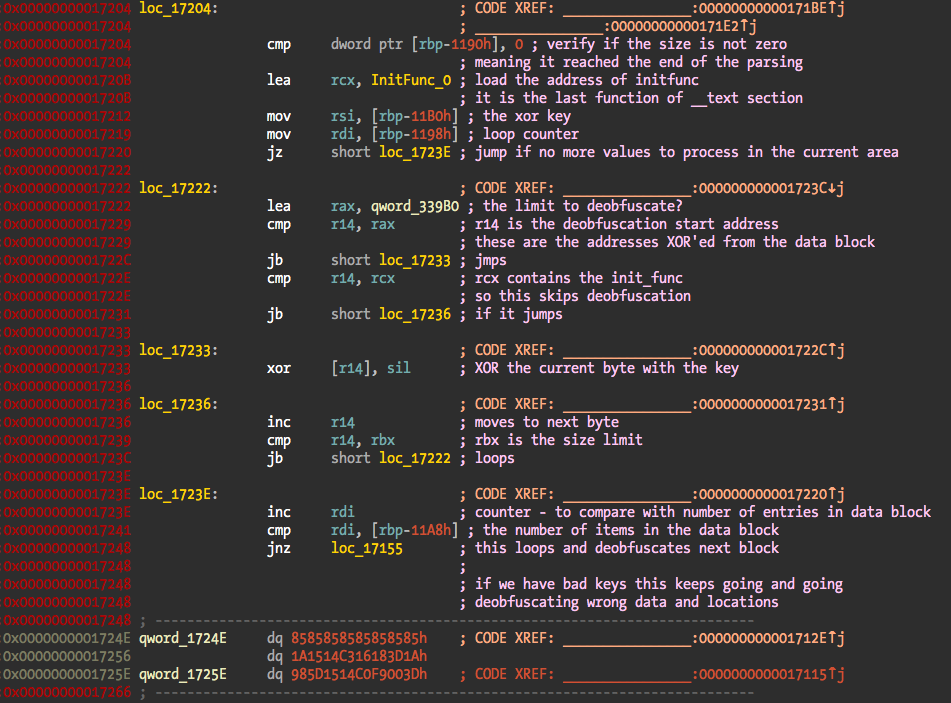
After code resumes execution it will just exit if running under the debugger since it contains the same thread based code to detect and exit the process. If we set a breakpoint at the address after the conditional jump we can dump the deobfuscated binary from memory without any problems. No need for that since semtex and sx4 are able to do it.
Left image is the original code, right image the deobfuscated version using one of the tools:
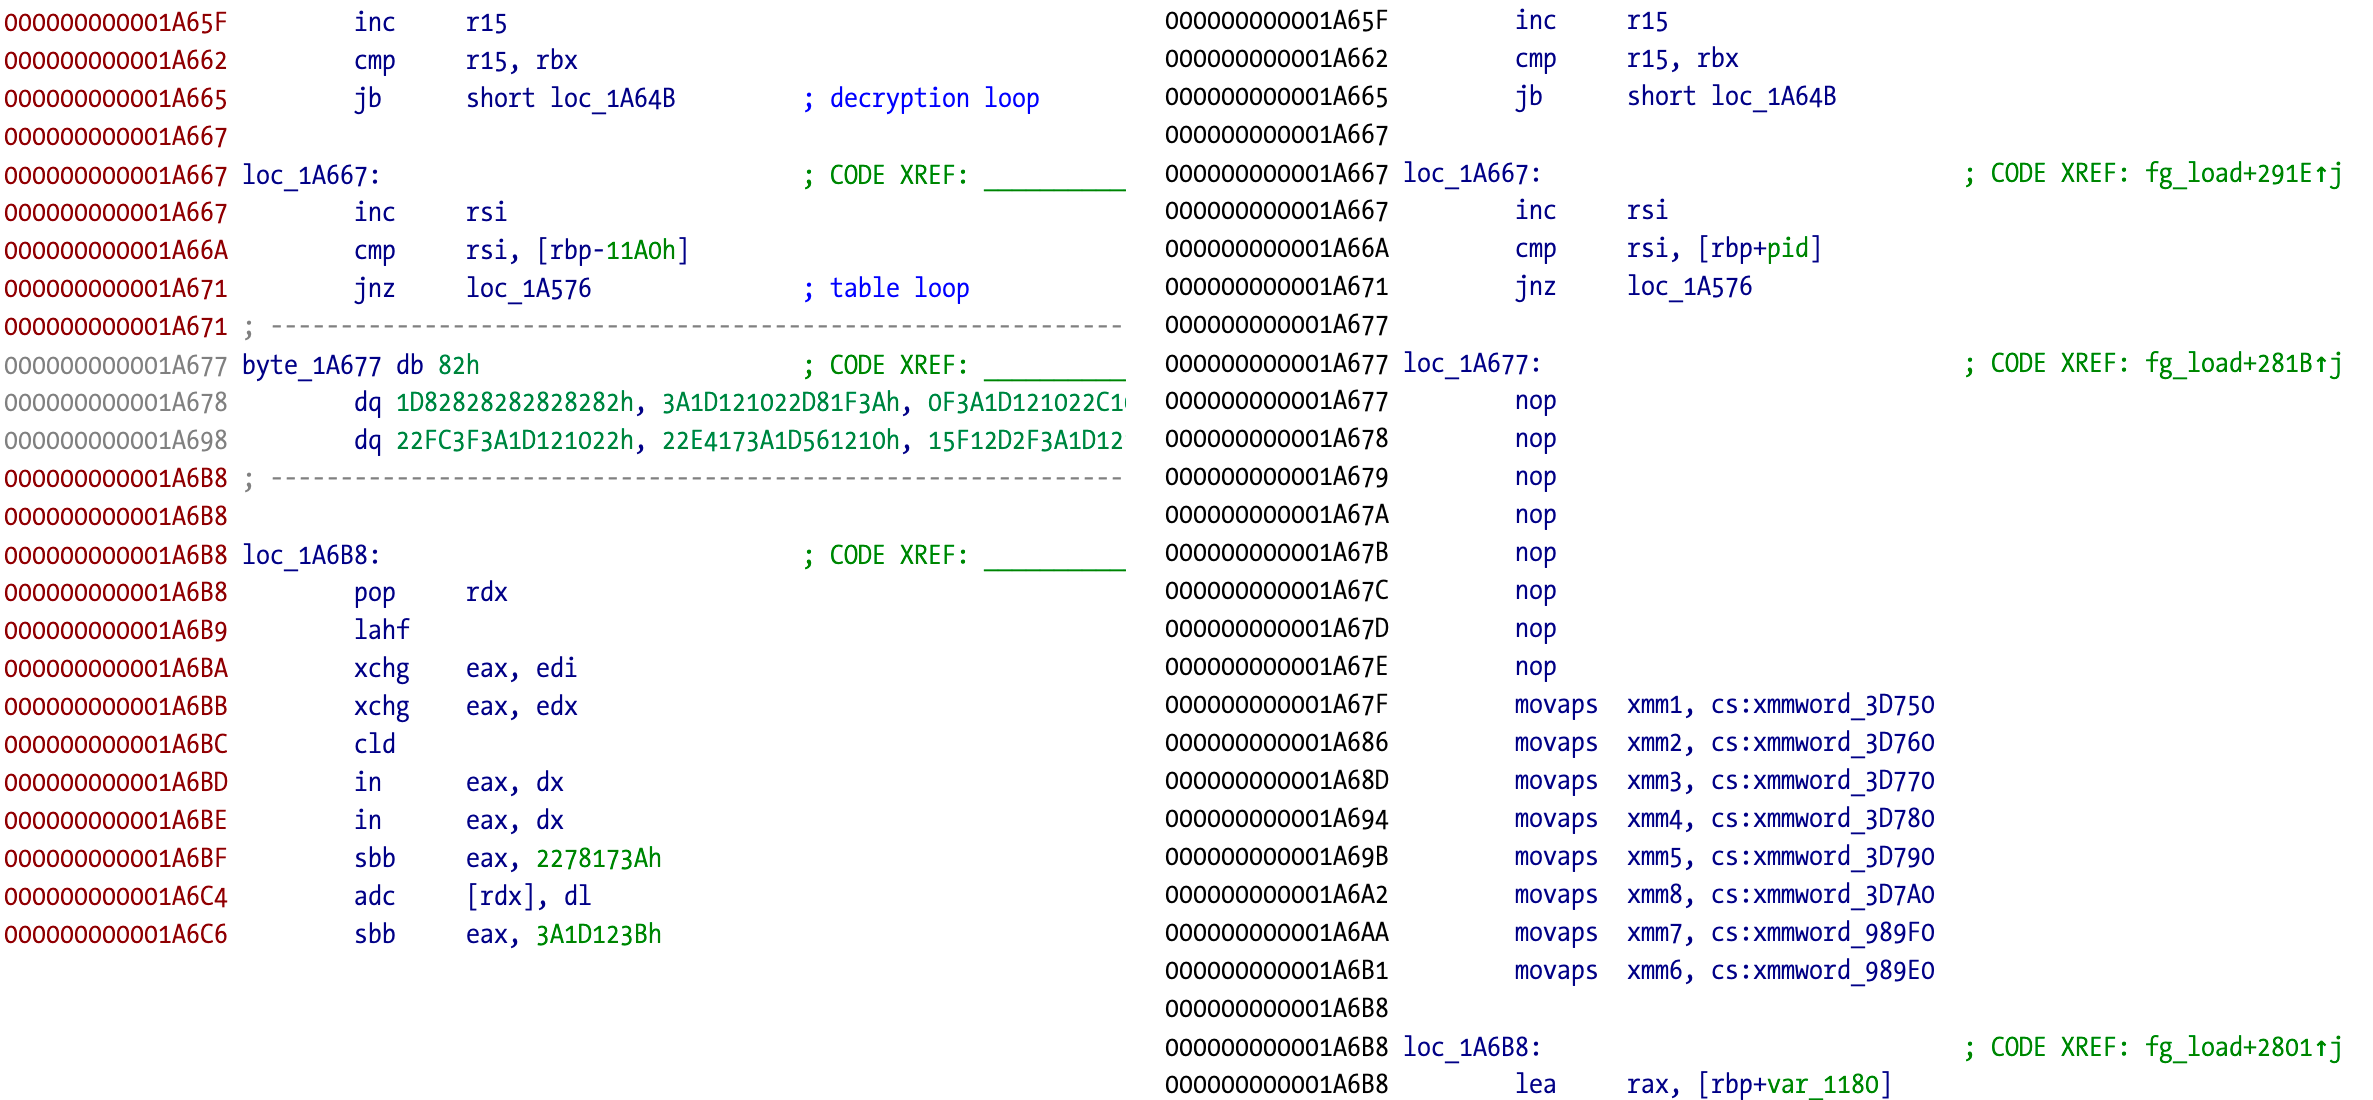
In this case the execution resumes after the deobfuscation loop at address 0x1A677.
Now we have all the pieces that allow us to deobfuscate and debug the binary at will. First we need to deobfuscate the binary, statically or dynamically, next we can patch the different anti-debugging checks, first the ASLR slide value, and next the anti-debugging threads. At least the crack related code can be easily statically analysed since it’s mostly swizzling and/or hooking and the replacement functions usually just return a value. That is the last part.
The Downie app and Ukraine
With the library fully deobfuscated and anti-debugging bypassed, it’s time to go after the real question(s) that got me interested. Is the crack malicious, in particular against Ukraine based users? There are known reports of infected cracks specifically targetting Ukraine, so this is a very interesting question.
Sandworm APT Targets Ukrainian Users with Trojanized Microsoft KMS Activation Tools in Cyber Espionage Campaigns
Sandworm Hackers Exploit Pirated Software in Ukraine: A Deep Dive into Cyber Espionage
Pirated Microsoft Office copy caused utility firm breach
Russian military hackers deploy malicious Windows activators in Ukraine
The target application for this section is Downie.
Copycat wrote me that there were some Ukraine related strings and locale checks. Locale and keyboard configuration, are an easy, reliable and often used technique to decided wether to run malicious payloads or not. Not a smart idea to risk a wiper against your own country :-].
Downloading the original application and grep’ing for Ukraine produces the following results:
$ rg --binary *
Resources/ru.lproj/Localizable.strings
1075:"🇺🇦 Show Solidarity with Ukraine" = "🇺🇦 Проявить солидарность с Украиной";

Resources/en.lproj/Localizable.strings
1075:"🇺🇦 Show Solidarity with Ukraine" = "🇺🇦 Show Solidarity with Ukraine";

$ strings MacOS/Downie\ 4 | rg Ukraine
_showSolidarityWithUkraineButton
T@"NSButton",N,W,V_showSolidarityWithUkraineButton
XUShowSolidarityWithUkraine
_showSolidarityWithUkraineButton
_showSolidarityWithUkraineButton
set_showSolidarityWithUkraineButton:
showMoreInformationAboutUkraine:
toggleShowSolidarityWithUkraine:
The original app appears to have some kind of pro-Ukraine support messaging and code. That might not go well with a Russia based cracking group…
Let’s take a look at the deobfuscated strings from the crack since those methods could be potential targets for swizzling:
% ./c4 -i libC.dylib.i64

          .d8888b.      d8888
         d88P  Y88b    d8P888
         888    888   d8P 888
         888         d8P  888
         888        d88   888
         888    888 8888888888
         Y88b  d88P       888
          "Y8888P"        888

    C4 - A TNT team crack analyser
    (c) 2025 fG! - reverser@put.as
    ------------------------------

[DEBUG] Initializing IDA library
IDA identified 348 functions.
(...)
[DEBUG] Size of obfuscator candidates is 78
[DEBUG] Analysing potential string obfuscator @ 0x4dd0
[DEBUG] ==> Decrypted string: "NSString" with XOR key 0x93
[DEBUG] Analysing potential string obfuscator @ 0x4bd0
[DEBUG] ==> Decrypted string: "NSApplication" with XOR key 0x93
[DEBUG] Analysing potential string obfuscator @ 0x49d0
[DEBUG] ==> Decrypted string: "NSMenuItem" with XOR key 0x93
(...)
[DEBUG] Analysing potential string obfuscator @ 0x7e70
[DEBUG] ==> Decrypted string: "4907" with XOR key 0x38
[DEBUG] Analysing potential string obfuscator @ 0x8410
[DEBUG] ==> Decrypted string: "K'ed by TNT team" with XOR key 0x38
[DEBUG] Analysing potential string obfuscator @ 0x88a0
[DEBUG] ==> Decrypted string: "NSDate" with XOR key 0x38
(...)
[DEBUG] Found 78 obfuscator functions. Valid: 78
========= Deobfuscated strings =========
NSString
NSApplication
NSMenuItem
sharedApplication
mainMenu
numberOfItems
alloc
initWithTitle:action:keyEquivalent:
stringWithUTF8String:
TNT
itemAtIndex:
hasSubmenu
submenu
addItem:
separatorItem

4907
K'ed by TNT team
NSDate
alloc
initWithTimeIntervalSince1970:
NSString
stringWithUTF8String:
TNT edition
09.05.1945
MacOS/Downie 4
Downie 4.app
NSUserDefaults
standardUserDefaults
synchronize
setValue:forKey:
TNT team
Release Group
setBool:forKey:
SUEnableAutomaticChecks
SUSendProfileInfo
SUAutomaticallyUpdate
_$s10Foundation6LocaleV6DownieE9isRussianSbvg
_TtC6Downie37XUAppearancePreferencesViewController
toggleShowSolidarityWithUkraine:
showMoreInformationAboutUkraine:
Licensing
_$s9Licensing11CMLicensingC10isLicensedSbvg
DownieCore
_$s10DownieCore16XUCrackProtectorV19isTNTCrackInstalledSbvg
Paddle
PADProduct
verifyActivationDetailsWithCompletion:
activationDate
activationEmail
licenseCode
activated
XUCoreUI
_TtC8XUCoreUI15XUMessageCenter
_launchMessageCenter
gdb
lldb
debugserver
mac_server
opper
NSBundle
mainBundle
objectForInfoDictionaryKey:
UTF8String
__TEXT
__DATA
__LINKEDIT
__DATA_CONST
__text
NSObject
applicationDidBecomeActive:
NSNotificationCenter
NSString
defaultCenter
addObserver:selector:name:object:
stringWithUTF8String:
class
NSApplicationDidFinishLaunchingNotification
========= End Deobfuscated strings =========
[DEBUG] ******** Locating anti-debugging calls ********
[DEBUG] => Found pthread call @ 0x9169 @ offset 0x9169 patch with 06 00 00 14
[DEBUG] => Found pthread call @ 0xcdd8 @ offset 0xcdd8 patch with 06 00 00 14
[DEBUG] => Found pthread call @ 0x1e07c @ offset 0x1e07c patch with 06 00 00 14
[DEBUG] => Found pthread call @ 0x21ab4 @ offset 0x21ab4 patch with 06 00 00 14
[DEBUG] => Found pthread call @ 0x2553d @ offset 0x2553d patch with 06 00 00 14
[DEBUG] => Found pthread call @ 0x28f6e @ offset 0x28f6e patch with 06 00 00 14
[DEBUG] => Found pthread call @ 0x28fdd @ offset 0x28fdd patch with 06 00 00 14
[DEBUG] => Found pthread call @ 0x2ca89 @ offset 0x2ca89 patch with 06 00 00 14
[DEBUG] => Found pthread call @ 0x3058c @ offset 0x3058c patch with 06 00 00 14
[DEBUG] => Found pthread call @ 0x342f8 @ offset 0x342f8 patch with 06 00 00 14
Biggest function is sub_17D2B @ 0x17d2b with 100681 bytes
Some eye catching strings are:
09.05.1945_$s10Foundation6LocaleV6DownieE9isRussianSbvgtoggleShowSolidarityWithUkraine:showMoreInformationAboutUkraine:
I also like this one _$s10DownieCore16XUCrackProtectorV19isTNTCrackInstalledSbvg, meaning that the author and/or Paddle are playing crack’n’seek games with TNT 💀.
Let’s take a look at the replacement methods to understand what is going on. The crack usually follows these steps:
- Deobfuscate the target method string.
- Retrieve the implementation pointers.
- Swap the implementation using jump hooks (or swizzling in ARM64).
- Move to the next method.
Everything necessary is usually nearby each string deobfuscation call. The C4 output tells us to which function does the string belong to, so it’s easy to cross reference and find its caller.
Initially I thought that method swizzling was used but that is false in the x86_64 version. A classic jmp hook is used instead.
Let’s analyse what is happening with the toggleShowSolidarityWithUkraine: method.
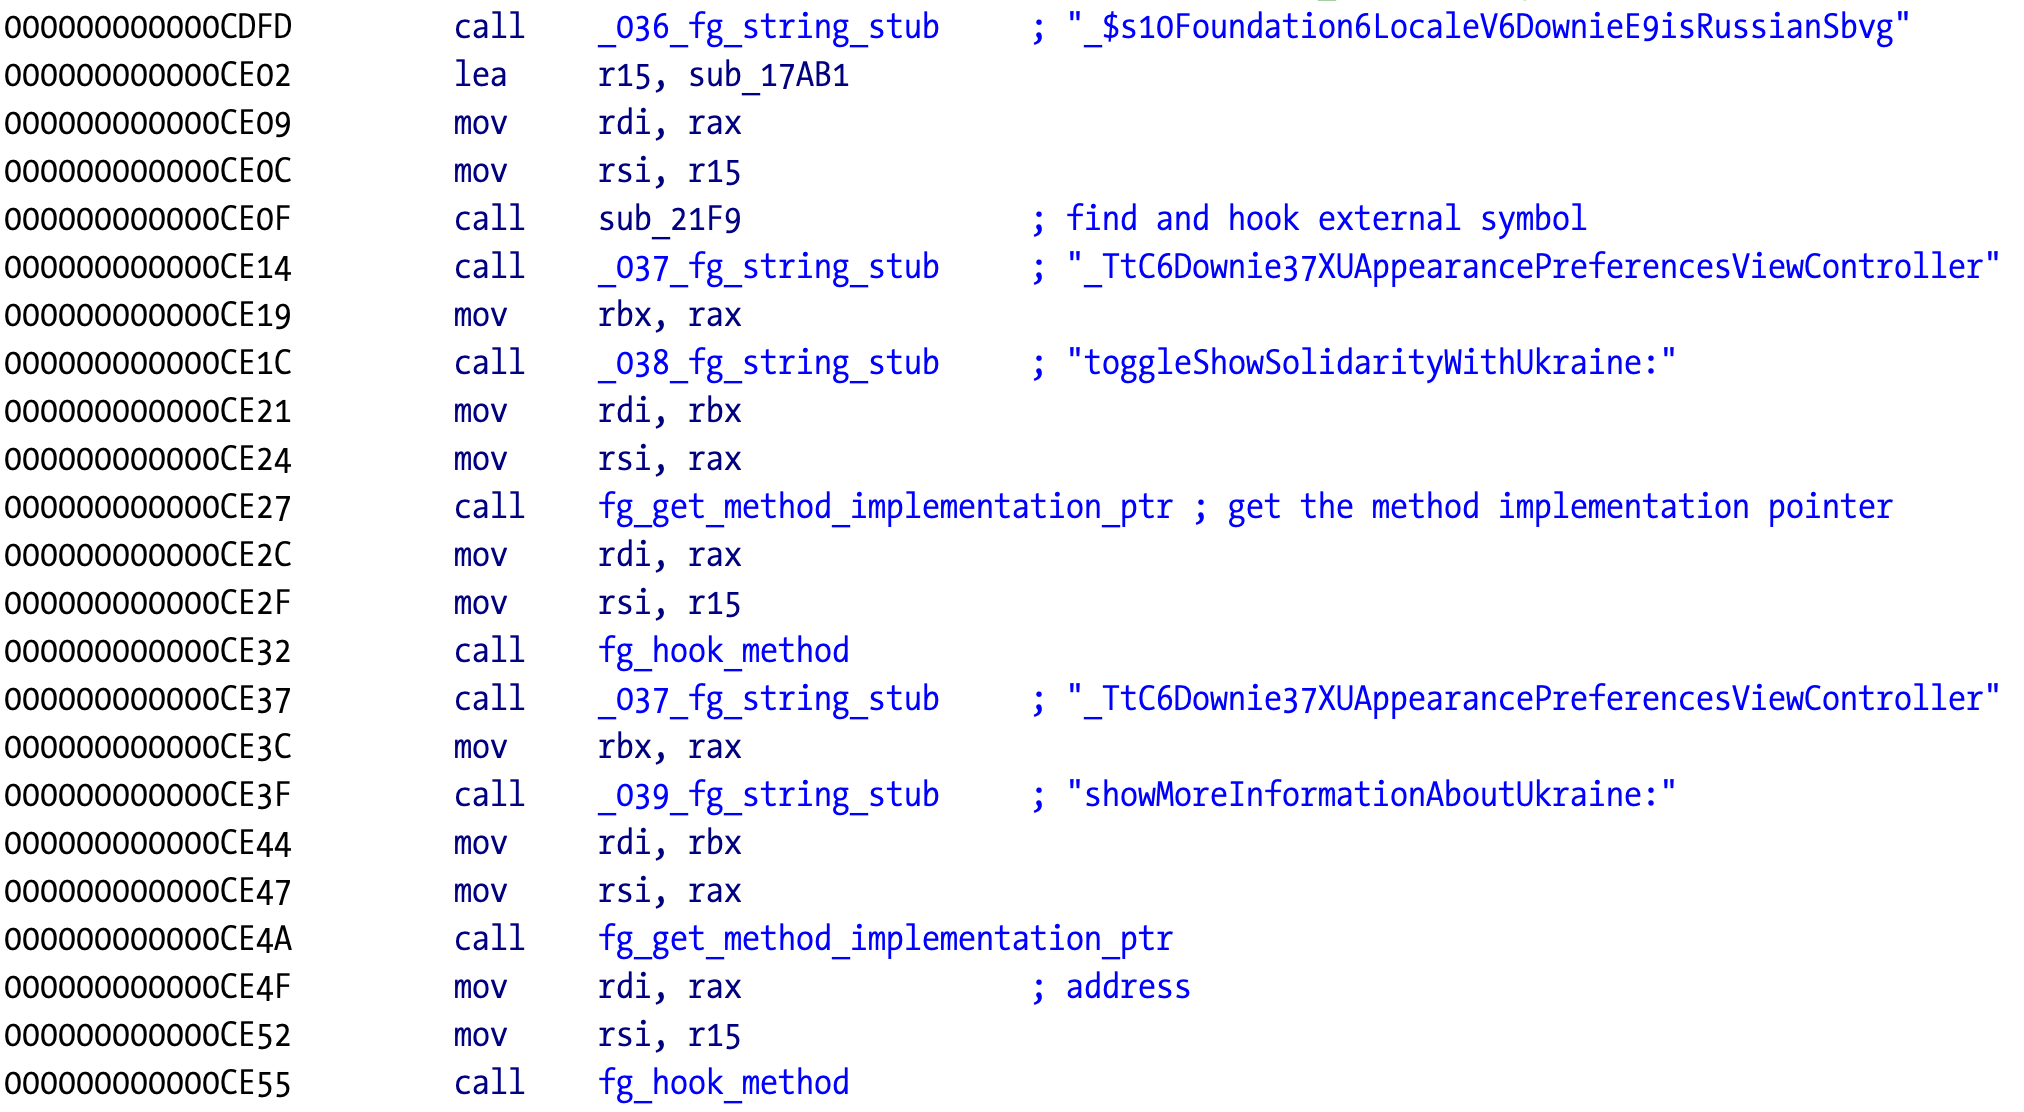
The C4 tool renamed the entrypoint stub functions used to deobfuscate strings and added comments with the target string for easier reference.
The first string is _TtC6Downie37XUAppearancePreferencesViewController, which is the class the method belongs to. Next is the target method toggleShowSolidarityWithUkraine:. We can confirm this by looking at the next function labeled fg_get_method_implementation. Its pseudocode is:
IMP __fastcall fg_get_method_implementation(const char *className, const char *methodName)
{
  objc_class *Class; // rbx
  const char *selector; // rax
  objc_method *InstanceMethod; // rax

  Class = objc_getClass(className);
  selector = sel_registerName(methodName);
  InstanceMethod = class_getInstanceMethod(Class, selector);
  return method_getImplementation(InstanceMethod);
}
The decompiler has no problems and we can comment the variables for a clean output. The return value is a function pointer of type IMP. Essentially this function locates the address where the method is located at.
The returned pointer is the first argument to the next function fg_replace_method_implementation. The second argument isn’t shown in the screenshot but it’s another function pointer to the replacement function.
000000000000CE02 lea r15, sub_17AB1
The replacement function is a simple return zero, transforming the original method into a nop.
__int64 sub_17AB1()
{
  return 0LL;
}
We just need to understand the function that implements the replacement.
kern_return_t __fastcall fg_replace_method_implementation(mach_vm_address_t address, __int64 a2)
{
  kern_return_t result; // eax
  mach_port_t *v3; // r14
  _WORD data[12]; // [rsp+0h] [rbp-30h] BYREF
  __int64 v5; // [rsp+18h] [rbp-18h]

  v5 = *(_QWORD *)__stack_chk_guard_ptr;
  result = 4;
  if ( address && a2 ) { // test if addresses aren't zero
    if ( address == a2 ) { // already hooked if the addresses are equal
      return 1;
    } else {
      data[0] = 0x25FF; // start of a JMP instruction
      *(_DWORD *)&data[1] = 0; // this makes the first bytes FF 25 00 00 00 00
      *(_QWORD *)&data[3] = a2; // write the 64 bit destination address after (6 bytes from the start)
      v3 = mach_task_self__ptr;
      // change memory protection to VM_PROT_ALL | VM_PROT_COPY
      result = mach_vm_protect(*mach_task_self__ptr, address, 0x10uLL, 0, 23);
      if ( !result ) {
      	// write the hook - 16 bytes
      	// 6 + 8 were set , with 2 "leaking" bytes
        result = mach_vm_write(*v3, address, (vm_offset_t)data, 0x10u);
        if ( !result )
        	// restore protection to VM_READ | VM_EXECUTE
          return mach_vm_protect(*v3, address, 0x10uLL, 0, 5);
      }
    }
  }
  return result;
}
This function shows that traditional method swizzling with class_replaceMethod, method_setImplementation or others is not used but instead is implemented with straightforward jump hooking.
The initial bytes of the hooked function will be transformed into:
FF 25 00 00 00 00            jmp qword ptr [rip]
00 00 00 00 00 00 00 00 new  function address
This code will jump to whatever value is deferenced after the jmp instruction. In this case that value is set to the replacement function address and everything will be ok.
So technically it’s not a replace method implementation function as I initially labelled, but just a hook installer that can be used for Objective-C methods but also C functions (or anything else) as long there is enough space in the original function to setup the hook. The minimum space for this implementation in x86_64 is 14 bytes.
The _$s10Foundation6LocaleV6DownieE9isRussianSbvg function is also hooked but in a slightly different way because it’s not an Objective-C method.
The original code can be found in the main binary:
% nm Downie\ 4| grep s10Foundation6LocaleV6DownieE9isRussianSbvg
00000001000c35a0 t _$s10Foundation6LocaleV6DownieE9isRussianSbvg
It appears to be a Swift method and IDA demangles it to Locale.isRussian.getter().
A quick look into the pseudocode:
v8 = Locale.languageCode.getter();
(...)
   if ( v8 == 30066 && v9 == 0xE200000000000000LL )
And finally searching Apple’s documentation:
Locale.LanguageCode An alphabetical code associated with a language.
The code retrieves the current locale of the host where it’s running and if it’s Russian do something and return true.
One of the callers of that method enables the pro-Ukraine support messaging if it detects the Russian locale.
  v9 = Locale.isRussian.getter();
  (*(void (__fastcall **)(__int64 *, __int64))(v78 + 8))(&v76, v77);
  v10 = v80;
  v11 = XUPreferences.boolean(for:defaultValue:)(
          0xD00000000000001BLL,
          "yWithUkraineButton" + 0x8000000000000000LL,
          v9,
          v80,
          v79,
          v6,
          v8);
The replacement function for this Swift code is the same returning zero as we saw before. So when the hook is implemented the cracked app will never detect the Russian locale and fail to enable any pro-Ukraine or anti-Russia logic that it might have.
The hook installer code in this case requires some extra steps because it’s not an Objective-C method. Instead it tries to locate the symbol address in the loaded images (it is located in the main binary as we saw) using NSLookupSymbolInImage and NSAddressOfSymbol APIs from dyld. When the address is found, it calls the same function we saw before to install the jump hook.
The other visible Ukraine related method is also hooked using the same replacement function. All Ukraine related code is effectively neutered by the crack.
The same technique is used to implement the crack, usually hooking a isRegistered: method and returning YES, true, or whatever the application expects as valid, but can also be more complicated when needing to defeat Paddle or other more complex DRM implementations.
Instead of traditional disk patching everything is done in runtime from the injected library. The only disk patching is to inject the library into the main binary or linked frameworks. It’s a more flexible and powerful solution.
The most frequent target for the library injection is the Sparkle framework. In Downie’s case it is the Paddle.framework:
otool -l "Downie 4.app/Contents/Frameworks/Paddle.framework/Versions/A/Paddle"
Downie 4.app/Contents/Frameworks/Paddle.framework/Versions/A/Paddle (architecture x86_64):
(...)
Load command 25
          cmd LC_LOAD_DYLIB
      cmdsize 72
         name @loader_path/../../../../Resources/libC.dylib (offset 24)
   time stamp 0 Thu Jan  1 01:00:00 1970
      current version 4.0.0
compatibility version 4.0.0
This avoids modifying the main binary and any potential checksum checks. Less work is more :-).
ARM64 hooking
In the ARM64 version we can find method swizzling. Next is a code sample for a random crack, where the target app implements a basic isTrialPeriod method. This is commonly cracked by returning false or the number of available days. The replacement method sub_9434 just returns 0 in this case.
The swizzling happens when the original method is overwritten by a new implementation using method_setImplementation.
  v1505 = (const char *)28_fg_callstub();       // obf: "AppDelegate"
  v1506 = (const char *)30_fg_callstub();       // obf: "isTrialPeriod"
  v1507 = objc_getClass(v1505);
  v1508 = sel_registerName(v1506);
  v1509 = class_getInstanceMethod(v1507, v1508);
  if ( v1509 )
    method_setImplementation(v1509, (IMP)sub_9434);// same thing, now returns 0
Looking at a few different samples, I couldn’t find an equivalent jump hooking in the ARM64 version. Possible reasons could be to avoid any code signing issues on Apple Silicon, maybe not needed, or the x86_64 version is like that for legacy reasons (cracker’s technical debt!).
Benign code injection
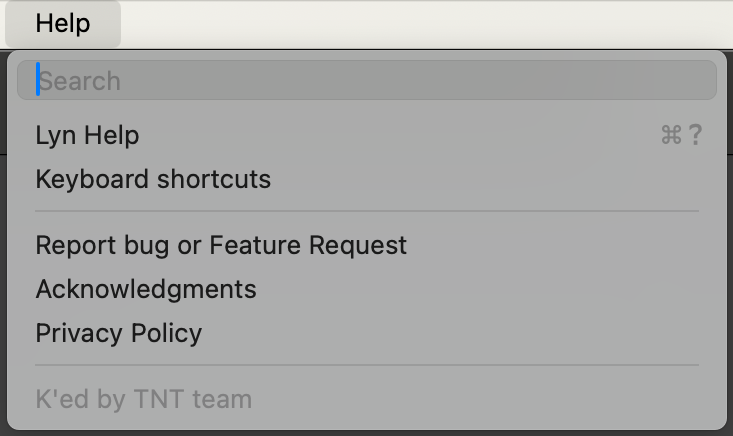
The TNT team tags each app with an entry in the help menu. Another demo of full control of the target app.
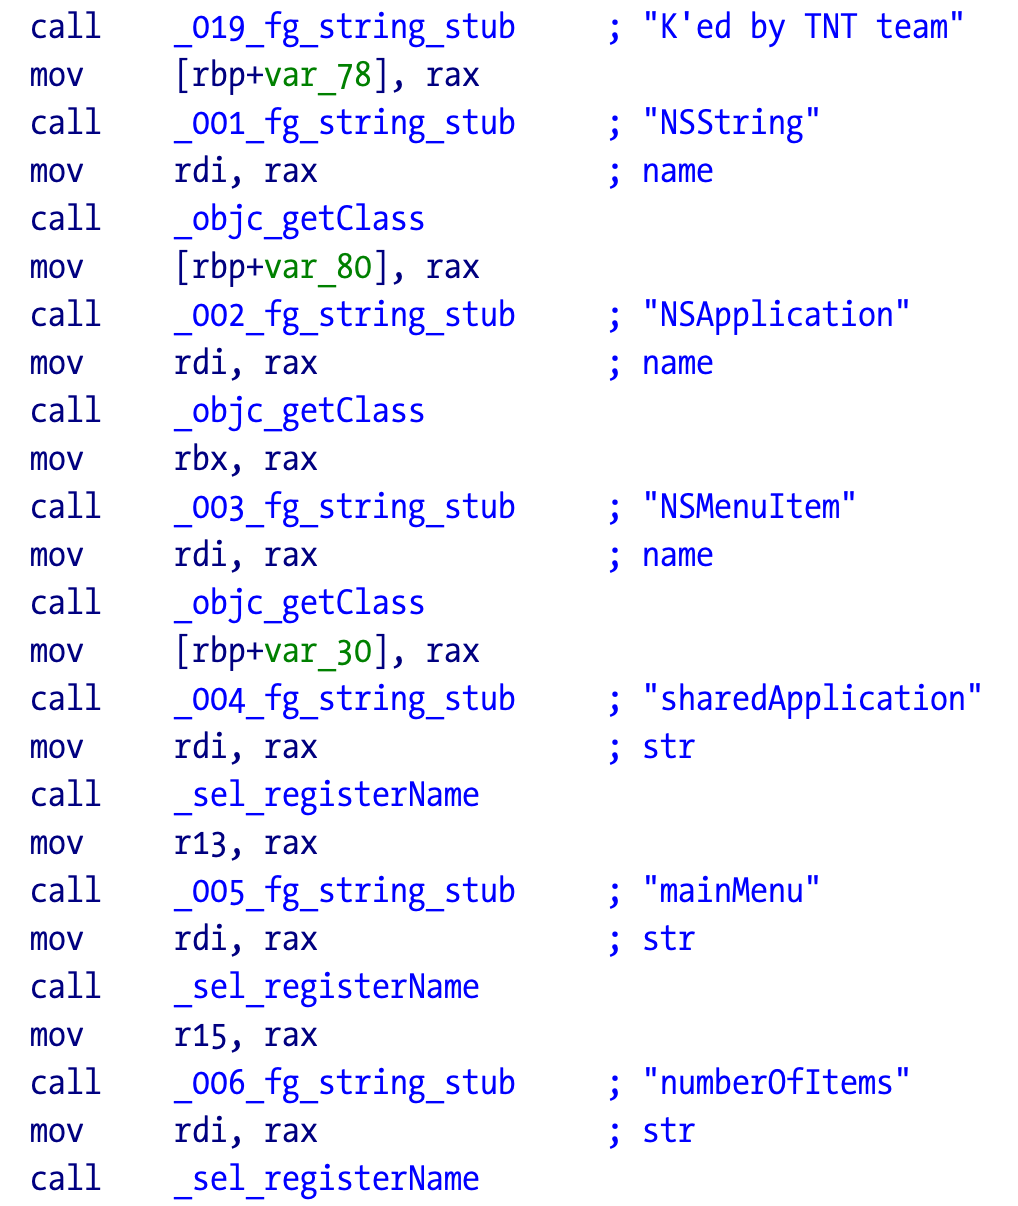
The code retrieves the menu entries of the application and locates the right spot to inject their menu item:
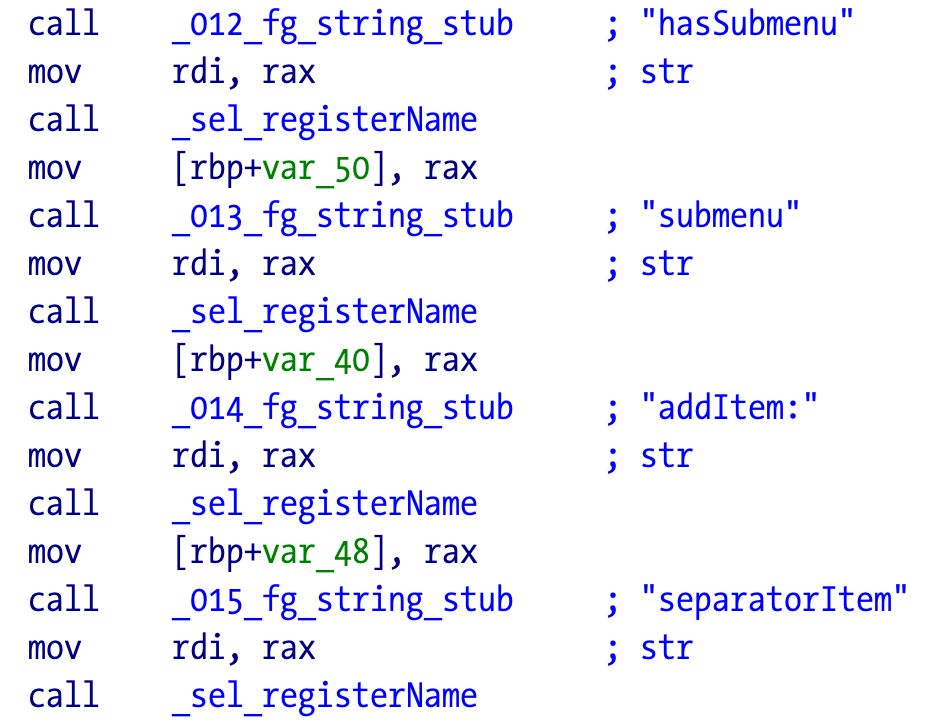
Here is the part that injects the separator before the team “tag”.
Conclusion

As described before there were already examples of pirated software used for cyber espionage in this war. Cyber operations were and are important in this conflict (there are recent reports that Ukraine train system suffered a cyber attack paralysing its ticketing system, and then a counter cyber-attack on Russian train system). There was a lot of initial hype three years ago and maybe cyberwar didn’t lived up to that hype (honestly, I assume we really don’t know the full story). But it is certain that both sides are involved in these type of operations and their impact is real.
I couldn’t find (yet?) any malicious traces in the few samples I looked at. Downie contains clear modifications to disable any pro-Ukraine messaging.
But as we have seen, the cracks have full control of the host process and malware can be easily added to this. If the host application has powerful permissions such as full access to the file system (the amount of TCC bypasses still coming out is ridiculous, but that’s another problem) and network, then it’s extremely easy to abuse this for malicious purposes - retrieve and exfiltrate date without raising significant alarms if for example Little Snitch is running but the user setup permissions to connect anywhere because user trusts the app and gets tired of those pesky permission dialogs.
The cracks are protected by light obfuscation and anti-debugging, which doesn’t help the case. This most probably was created long time ago to protect the cracks (since it’s easy to just copy them and now race the releases) but it’s a system that can be abused. Who is the source of the decision to patch any pro-Ukraine messaging?
Even if the original group has no intention to add malicious behavior to their work, the distribution to the general population can be easily corrupted by any site with the wrong incentives. TNT signs and hashes their releases, but how many users verify that information? Probably very few to none.
Extra care should be taken by users. And that is true for these or any other cracks. And even regular software is at danger given the increasing amount of supply chain attacks. The amount of implicit trust is ridiculous these days. I love Halvar’s trust graphs image, and one I always keep at hand.

This was a fun target to reverse engineer and create tools for. I hope you also add some fun and hopefully learnt something.
Old school greets to Copycat for starting this adventure, and the TNT team for making it possible.
Oh, after almost three years since leaving my startup and enjoying life, I’m kinda interested in returning to the job market. I’m not sure what I want to do, I am flexible. I really enjoy solving weird problems, reversing, and developing tools and proof of concept solutions. I did quite a few engineering work over the last years but not much interested on that kind of position - I rather solve the problems and create the PoC, and let the real engineers make a real product out of it. Get in touch if you think you might have something interesting.
Have fun,
fG!